Why Treating Trading Like an Engineering Problem Changes Everything (A Developer's Journey)

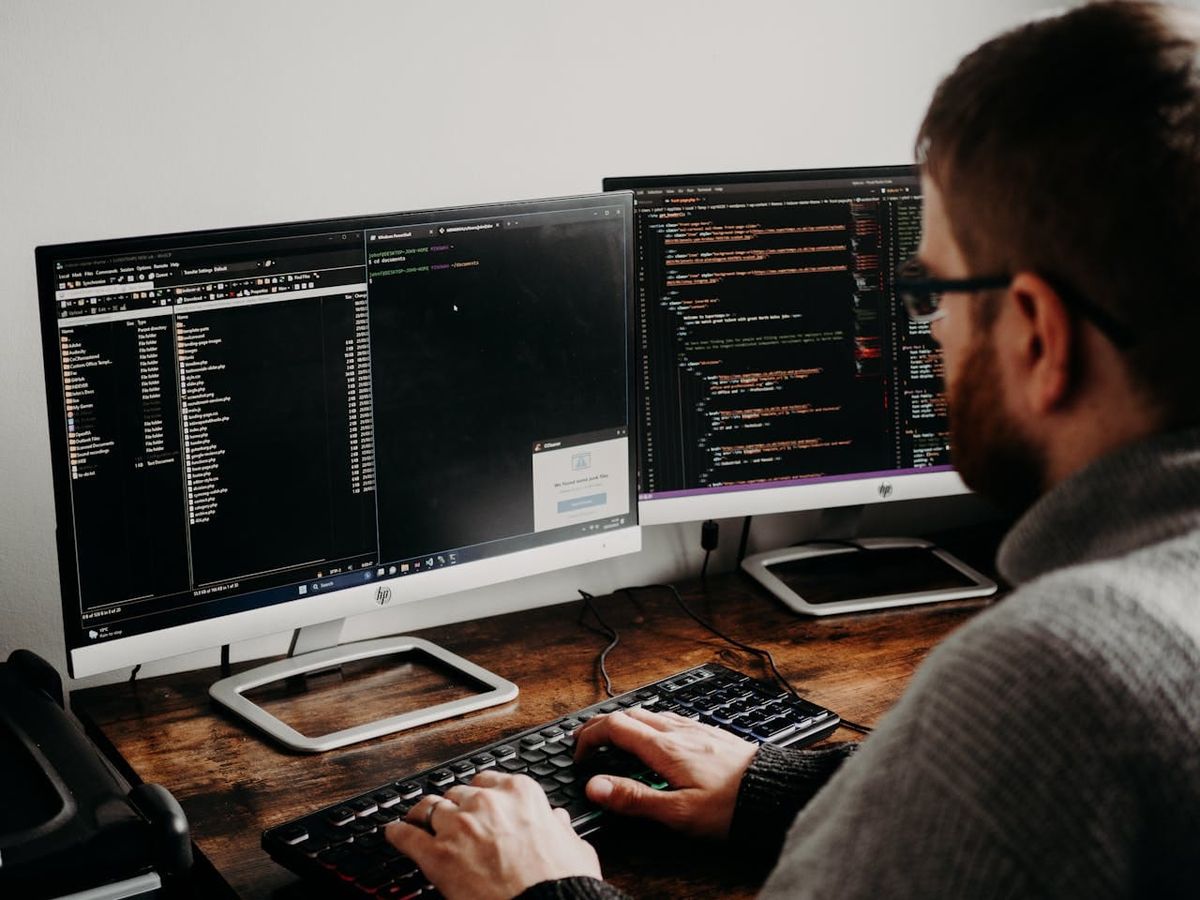
Inspired by a viral r/Daytrading post from a senior developer who quit his job to trade full-time
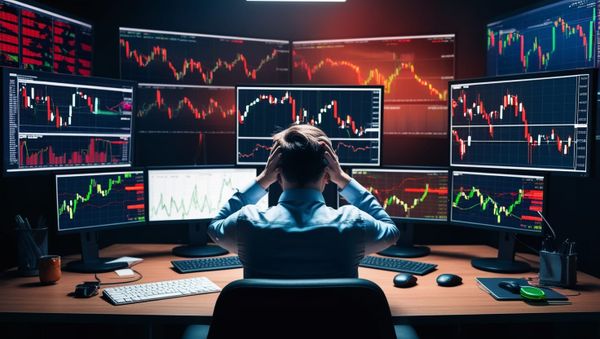
If you've been trading for any length of time, you've probably felt it: that sinking realization that you're fighting against yourself more than the market.
You see the setup. You know the entry. But your finger hovers over the button while fear whispers "what if this one's different?"
Or worse — you take the trade, watch it move against you by three ticks, and exit in a panic right before it rockets in your direction.
A recent post on r/Daytrading caught my attention. A senior software developer shared his journey from losing enough money to "buy a nice car" trading visual patterns, to netting over $127,000 in a single year after treating trading like what it actually is: an engineering problem.
His insight cuts to the heart of what separates struggling traders from profitable ones:
"The whole game turned 180 degrees when I realized that the charts you are looking at are literally designed to trap you."
Let's break down what he discovered — and why the engineering mindset might be the edge most traders are missing.
The Pattern Trader's Graveyard
Before finding his edge, this developer spent nearly two years doing what most traders do: hunting for wedges, flags, head and shoulders, and whatever formation looked "perfect" on a 5-minute chart.
Sound familiar?
The problem isn't that these patterns don't exist. They do. The problem is that everyone sees them.
As the trader put it:
"Everyone draws the same lines. That's why you get stopped out by 2 ticks before the price reverses."
When 10,000 retail traders all identify the same support level and place their stops at the same price, that cluster of stops becomes a liquidity target. Institutions and market makers see that liquidity pool and use it — sweeping stops to fill their orders before the "real" move begins.
This isn't conspiracy theory. It's market mechanics. And it's why pattern trading, in isolation, fails more traders than it helps.
The Engineering Approach: Treat the Market as a Database
Here's where the developer's background changed everything. Instead of looking at charts as pictures to interpret, he started treating the market as what it actually is: a database of transactions.
Every tick represents a buyer meeting a seller at an agreed price. The order flow — the sequence and size of these transactions — tells a story that candlestick patterns simply cannot.
"If you can read it (DOM, order flow), you can see where the big players are positioning."
The developer built a semi-automated system that processes tick data in real-time, calculating volumetric pressure and statistical thresholds. When conditions align, the system pings him. He executes. No guessing. No "feeling" the market.
The result? A complete removal of emotional decision-making.
Why "Visual Pattern" Trading Fails Most Traders
The viral Reddit post sparked massive engagement because it articulated something many traders sense but can't name: chart patterns are retrospective, not predictive.
You identify a pattern after it forms. By then, the information is already priced in. The only traders profiting from that pattern are the ones who saw the underlying order flow dynamics that caused it.
Consider the double bottom pattern. Visually, it looks like support held twice, suggesting bullish momentum. But what actually happened?
- Price dropped to a level where large passive buyers had resting limit orders
- Aggressive sellers exhausted themselves against those orders
- When selling dried up, buying pressure pushed price higher
- This process repeated at the same level
The pattern isn't magical. It's a visual artifact of order flow dynamics. If you understand the dynamics, you don't need the pattern.
The developer's system tracks this directly:
"I don't just look at candle closes, but I track the sequence of tick trades within the candle coming through the time and sales."
By monitoring cumulative volume delta — the net difference between aggressive buying and aggressive selling — he can identify when sellers are exhausting themselves, not after price has already reversed.
The Cheat Code: Delta Divergence
Perhaps the most valuable insight from the post was the concept of delta divergence:
"Imagine price is crashing HARD. You're panicking and obviously, you sell. But the script sees that while price is making a lower low, the cumulative volume delta is flatlining or ticking up."
Translation: price is falling, but aggressive selling isn't increasing. The sellers are dumping everything they have, but passive limit buyers are absorbing it all.
This is the moment right before a reversal — the exhaustion point where emotional retail traders are puking their positions at the worst possible time while institutional buyers quietly accumulate.
The developer's automated system catches this divergence in real-time. By the time a human trader spots it visually on a footprint chart, the opportunity has often passed.
"The human eye cannot process this data speed manually on NQ. By the time you spot a divergence on a standard footprint chart with your naked eye, the HFTs have already frontrun the move."
What His Results Actually Looked Like
The developer shared his 2025 statistics:
- Gross profit: $162,300
- Net profit: ~$127,000 (after fees, commissions, and tax set-aside)
- Win rate: 55% (now 60-65% after refinement)
- Risk-reward: 1:2.5 minimum
- Profit factor: 2.53
- Max drawdown: 6.2%
That 55% win rate might surprise beginners who assume profitability requires being right most of the time. But this is exactly how professional trading works: lose small, win big, let mathematics do the heavy lifting.
With a 1:2.5 risk-reward ratio, you can be wrong nearly half the time and still be highly profitable. The key is consistency — taking every valid setup without emotional interference.
The Real Edge: Removing Yourself from the Equation
Here's the insight that ties everything together:
"The script acts as a filter for stupidity. If the math isn't there, I don't trade. It removes the emotion. I don't have to 'guess' or 'feel' the market."
This isn't just about order flow analysis. It's about removing the flawed human element from trading decisions.
The developer didn't become profitable because he found a secret pattern or indicator. He became profitable because he built a system that:
- Defines setups objectively — either the criteria are met or they're not
- Removes discretion — if the signal fires, he takes the trade
- Eliminates emotional interference — no second-guessing, no "feeling" wrong
- Enforces risk management — every trade has the same risk profile
The engineering approach treats trading as what it is: a probabilistic game where edge compounds over time, but only if you execute consistently.
Can You Build This Yourself?
The developer's system took 8 months of iteration to stop generating "fake" signals during choppy conditions. It requires deep understanding of financial data modeling, tick-level analysis, and the specific limitations of platforms like TradingView.
He's clear that he doesn't share the source code:
"If 50,000 people start front-running the exact same tick divergence signal, the alpha disappears."
But here's the good news: you don't need to build a custom order flow system to apply the engineering mindset.
The Principles That Apply to Any Trader
1. Define Your Edge Objectively
If you can't explain your edge in concrete, measurable terms, you don't have one. "I look for reversal patterns at support" isn't an edge. "I enter when price sweeps the Asian low during NY open, then reclaims with displacement and a fair value gap" is getting closer.
2. Backtest Ruthlessly
Engineers don't ship code without testing. Why would you trade a strategy without statistical validation? Open a chart, start asking questions, and test the answers across hundreds of trades.
3. Remove Discretion Where Possible
Every decision point is an opportunity for emotion to sabotage you. The more you can systematize — entry criteria, stop placement, target levels, position sizing — the less room there is for your fear and greed to intervene.
4. Accept Probabilistic Thinking
A 55% win rate with 1:2.5 risk-reward is mathematically excellent. But it means you'll lose 45% of your trades. If that bothers you emotionally, you'll abandon the system after a string of losses — right before the winners come.
The Automation Advantage
For traders who don't have 8 months to build a custom system, there's a shortcut: let someone else's system do the heavy lifting.
Fully automated trading strategies remove human emotion from the equation entirely. They execute the same way every time, without fear, without greed, without that voice saying "maybe I should skip this one."
→ StealthScalp is a fully automated NinjaTrader 8 strategy that executes one trade per day using ICT-inspired fair value gap logic. No emotions. No second-guessing. Just systematic execution.
The developer's journey validates what automated trading aims to solve: the problem isn't usually the strategy. It's the trader executing it.
The Bottom Line
The viral Reddit post resonated because it articulated something traders intuitively know: the game is rigged against emotional decision-making.
The charts you're staring at aren't showing you objective reality — they're showing you a visual representation that's been optimized by market makers to trap predictable behavior.
The engineering solution is elegantly simple:
- Understand what's actually happening (order flow, not patterns)
- Define objective criteria for entry
- Remove yourself from the decision loop
- Let probability and risk-reward do the work
Whether you build your own system, use automated strategies, or simply adopt more systematic thinking, the lesson is the same:
Stop trading like a gambler. Start trading like an engineer.
Frequently Asked Questions
Do I need to be a programmer to trade systematically?
No. The engineering mindset is about systematic thinking, not coding. You can apply these principles by writing detailed trade plans, using alerts instead of watching screens, and journaling every trade to identify patterns in your behavior.
What's the minimum win rate needed for profitability?
It depends on your risk-reward ratio. With 1:2 risk-reward, you only need 34% win rate to break even. With 1:3, you need just 26%. Focus on risk-reward first, win rate second.
Why do patterns work sometimes but not others?
Patterns that "work" are usually backed by underlying order flow dynamics — exhaustion, absorption, liquidity sweeps. When you trade patterns in isolation without understanding the mechanics, you're essentially gambling on coincidence.
Can automation really remove emotions?
Yes. A fully automated strategy executes identically whether you're confident or terrified. This consistency is the entire point — it removes the human variable that causes most trading failures.
How long does it take to become profitable?
The developer in the Reddit post took years before building his system. Industry statistics suggest 2-5 years of serious effort for most traders. Automation can compress this timeline by removing the psychological learning curve.
The Reddit post referenced in this article was shared on r/Daytrading by a self-described senior full-stack developer. His specific system and code remain proprietary.
Ready to remove emotion from your trading?
→ Learn how StealthScalp automates one high-probability trade per day