The Doji Candle Pattern: Complete Guide for Futures Traders
A complete guide to the doji candlestick pattern — all 5 types, what they signal, confirmation methods, and how to use them in real futures trading.

The Doji Candle Pattern: Complete Guide for Futures Traders
The doji candle is one of the most misunderstood — and most powerful — patterns in technical analysis. Every serious futures trader has seen them. Few truly know how to use them.
In this guide, we'll break down exactly what a doji candlestick pattern is, walk through all five types, explain what each one signals, and show you how to apply them in real futures trading. No fluff, no vague "it might reverse" hand-waving — just actionable context.
What Is a Doji Candle?
A doji candlestick pattern forms when a candle's opening and closing price are the same — or nearly identical. The result is a candle with a very small or nonexistent body, flanked by upper and lower wicks of varying lengths.
What makes a doji significant isn't the shape itself — it's what that shape represents: a battle between buyers and sellers that ended in a draw. Price moved up, price moved down, and by the close, it was right back where it started.
That indecision is meaningful information. In a trending market, a doji can signal that momentum is fading. In a ranging market, it often confirms continued consolidation. Context is everything.
Doji patterns appear on every timeframe and in every market — equities, forex, crypto, and futures. They're especially powerful on higher timeframes (15-minute, hourly, daily) where each candle represents significant price discovery.
The 5 Types of Doji Candles (and What They Actually Mean)
Not all doji candles are equal. The shape of the wicks tells a very different story depending on where price traveled during that candle's session. Here are all five types you need to know.
1. Standard Doji
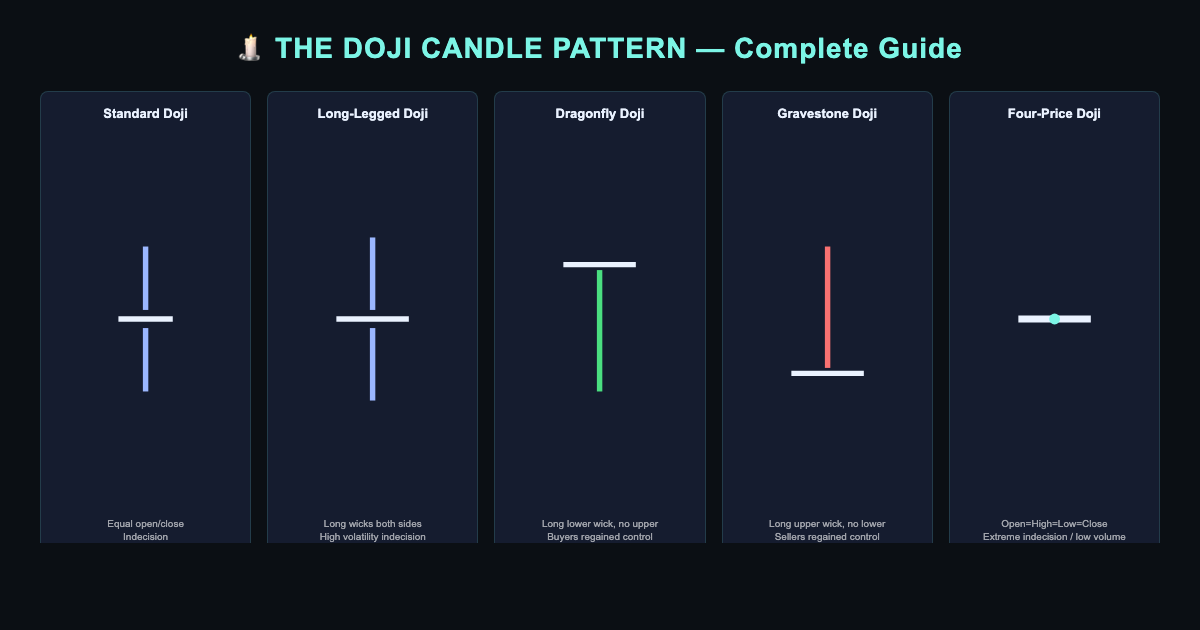
The standard doji (also called a neutral doji) has roughly equal upper and lower wicks with a small or invisible body near the middle. It looks like a plus sign or a thin cross.
What it signals: Pure indecision. Buyers pushed price up; sellers pushed it back. Neither side won. The standard doji is a pause in the market's narrative — not necessarily a reversal, but a moment of equilibrium worth paying attention to.
When it appears: Common during periods of low volatility, ahead of major news events, or at natural support/resistance zones when neither side is confident enough to commit.
How to trade it: On its own, the standard doji is a caution signal, not a trigger. Wait for the following candle to show direction. A strong bullish candle after a standard doji in a downtrend suggests potential reversal. A strong bearish candle in an uptrend suggests exhaustion. Always combine with a level of structure — don't trade standard doji in the middle of nowhere.
2. Long-Legged Doji
The long-legged doji is the most dramatic-looking of all doji types. It has long upper and lower wicks with a tiny body — often found near the center. The wicks can be 3–5x longer than a typical candle's range for that session.
What it signals: Extreme indecision and high volatility. Price was whipped in both directions aggressively, but ultimately settled back near the open. This candle often appears before a major directional move — the market is "testing the water" in both directions before committing.
When it appears: High-volatility environments, FOMC announcement sessions, pre-market gaps filling in, or at key inflection zones (weekly highs/lows, prior day highs/lows) in ES, NQ, or CL futures.
How to trade it: The long-legged doji is best treated as a volatility warning. In futures, this candle often precedes a breakout — but the direction isn't determined yet. Mark the high and low of the candle. A close above the wick high suggests bullish breakout; a close below the wick low suggests bearish. Use that candle's range as your risk reference.
3. Dragonfly Doji
The dragonfly doji has a long lower wick, virtually no upper wick, and the open/close/high are all at or near the same price level. Visually, it looks like a "T."
What it signals: Sellers drove price down aggressively during the session, but buyers stepped in and pushed it all the way back to the open by the close. This is bullish price rejection — the market tested lower prices and rejected them.
When it appears: Most powerful when it forms at a key support level, a demand zone, or after an extended downtrend. In NQ futures, a dragonfly doji at the prior session's low or a major moving average often precedes a significant bounce.
How to trade it: The dragonfly doji is one of the strongest single-candle reversal signals when it appears in the right context. Look for it at:
- Prior support / demand zones
- The lower boundary of a trading range
- Oversold RSI readings combined with a key structural level
- VWAP tests in morning futures sessions
Confirmation: a bullish candle closing above the dragonfly's open validates the setup. Stop goes below the wick low.
4. Gravestone Doji
The gravestone doji is the mirror image of the dragonfly. It has a long upper wick, virtually no lower wick, and the open/close/low are all at or near the same price. It looks like an inverted "T" — or a gravestone.
What it signals: Buyers pushed price up aggressively during the session, but sellers overwhelmed them and pushed it all the way back down to the open by the close. This is bearish price rejection at the highs — a warning that supply is present and willing to defend.
When it appears: Most significant at resistance levels, supply zones, all-time highs or prior swing highs, or after an extended uptrend where momentum is thinning. In ES futures, a gravestone doji at the prior day's high or a key Fibonacci extension is a high-probability fade setup.
How to trade it: Like the dragonfly, context is everything. The gravestone doji gains power when:
- It forms at clear overhead resistance
- Volume spikes during the wick formation (sellers are absorbing buyers)
- The market has been in an extended rally without pullback
- It appears near a prior failed breakout level
Confirmation: a bearish candle closing below the gravestone's open/low validates the short setup. Stop goes above the wick high.
5. Four-Price Doji
The four-price doji (also called the flat doji) is the rarest of all. It forms when the open, high, low, and close are all identical — resulting in a flat horizontal line with no wicks whatsoever.
What it signals: Complete stasis. Zero movement. The market didn't go anywhere — not up, not down. This typically means one of two things: extremely low liquidity (thin after-hours or holiday session), or a technical glitch/data anomaly.
When it appears: Most commonly seen during after-hours futures trading, early pre-market sessions, or on instruments with very low liquidity. You won't see this on a 5-minute ES chart during RTH — but it can appear on daily charts for thinly traded contracts.
How to trade it: The four-price doji is generally not a tradeable signal in isolation. Its main value is as a liquidity warning — if you're seeing these in a session, it means the spread is wide, fills will be poor, and you should wait for more active trading hours. In backtesting, they can sometimes indicate data gaps.
The Doji Pattern Meaning: What Traders Actually Get Wrong
Here's the truth most trading guides won't tell you: a doji candle alone means almost nothing.
The pattern meaning only becomes clear in context. The same doji that signals a bullish reversal at support is just noise in the middle of a range. The same gravestone doji that would be a high-probability short at resistance is irrelevant if there's no trend leading into it.
Traders who lose money on doji patterns usually make one of these mistakes:
- Trading them in isolation — without a key level to anchor the signal
- Skipping confirmation — entering on the doji itself instead of the following candle
- Ignoring volume — a dragonfly with zero volume isn't the same as one with a volume spike on the rejection
- Wrong timeframe — a doji on a 1-minute chart during lunch is not the same as a doji on the daily chart of ES
Confirmation Methods for Doji Signals
Whether you're trading the dragonfly, gravestone, or long-legged doji, the principle is the same: wait for confirmation before entering.
Candlestick Confirmation
The simplest method: wait for the candle after the doji to close. If you're expecting a bullish reversal (dragonfly at support), a strong bullish candle closing above the doji's body confirms. If bearish (gravestone at resistance), a bearish close below the doji validates the setup.
Volume Confirmation
Volume tells you whether the doji's indecision is meaningful. A dragonfly doji with above-average volume on the lower wick means sellers tried — and failed — with real conviction. That's powerful. A dragonfly with low volume might just be a slow lunch-hour candle. In futures, always check volume profile and VWAP.
Structural Confluence
The highest-probability doji setups form at confluence zones — places where multiple factors agree. Examples:
- Gravestone doji at prior week's high + overbought RSI + above VWAP → strong short bias
- Dragonfly doji at daily support + oversold conditions + volume spike on wick → strong long bias
- Long-legged doji at breakout level → wait for resolution, then trade the break
Trend Context
Reversal doji (dragonfly, gravestone) are most reliable against an existing trend at extreme levels. A dragonfly at the low of a multi-day downtrend in NQ futures carries more weight than one in the middle of a neutral range. The trend sets up the "spring," the doji is the coiling, and the confirmation is the release.
Using Doji Candles in Futures Trading: Practical Application
Futures markets — especially equity index futures like ES (S&P 500), NQ (Nasdaq), and RTY (Russell 2000) — are ideal environments to trade doji patterns because of their liquidity, volatility, and well-defined sessions.
Key Doji Setups in Futures
Opening Range Doji: In the first 15–30 minutes of RTH (Regular Trading Hours), a doji forming at the open signals uncertainty about direction. Traders often mark the doji's high and low as breakout levels for the morning session.
VWAP Rejection Doji: When price tests VWAP and forms a dragonfly or gravestone, it signals a VWAP rejection. This is one of the cleanest intraday setups — VWAP is a magnet for institutional order flow, and a doji at that level often precedes a mean-reversion move.
End-of-Day Reversal Doji: Doji candles forming in the final 30–60 minutes of the trading day (especially on the 15-minute or hourly chart) often signal position squaring. These can set up strong overnight trades in the direction of the afternoon reversal.
Key Level Tests: The most reliable doji setups in futures come at major levels: prior day high/low, weekly open, settlement price, VWAP, and significant moving averages (20 EMA, 50 EMA on higher timeframes). When a gravestone or dragonfly forms at these levels, it's a high-quality signal worth watching closely.
Risk Management with Doji Setups
One of the advantages of trading doji patterns is that they naturally define your risk:
- Long from a dragonfly: Stop below the wick low
- Short from a gravestone: Stop above the wick high
- Breakout from a long-legged doji: Stop at the opposite extreme of the doji's range
In ES futures, a dragonfly doji at support might give you a 2–4 point stop with a target of 8–12 points toward the day's high — a 3:1 reward-to-risk ratio on a well-structured setup.
Doji Candle Cheat Sheet: Quick Reference
| Doji Type | Shape | Signal | Best Context |
|---|---|---|---|
| Standard Doji | + (cross) | Indecision / pause | At S/R levels, pre-news |
| Long-Legged Doji | Long upper + lower wicks | High volatility indecision | Before breakouts, high-vol sessions |
| Dragonfly Doji | T (long lower wick) | Bullish reversal signal | Support zones, downtrend lows |
| Gravestone Doji | Inverted T (long upper wick) | Bearish reversal signal | Resistance zones, uptrend highs |
| Four-Price Doji | Flat line | No movement / low liquidity | After-hours, thin markets |
Why Manual Doji Trading Is Harder Than It Looks
Reading doji patterns sounds simple in theory. In practice, here's what happens:
You spot a dragonfly doji at support. You wait for confirmation. The next candle opens bullish — you enter. Then price reverses, runs your stop, and immediately bounces back. Classic stop hunt. You sit out. Price rips higher without you. Frustrating.
This isn't because doji patterns don't work. It's because manual execution is emotional. You second-guess entries. You move stops. You miss the confirmation candle because you hesitated. You're managing six things at once while a market that doesn't care about your feelings moves in milliseconds.
This is exactly the problem StealthScalp was built to solve.
StealthScalp is a fully automated NinjaTrader 8 trading bot that executes algorithmic strategies in futures markets without hesitation, emotion, or second-guessing. It runs rules-based entries and exits — no manual intervention required — so you stop leaving money on the table chasing candle patterns that slip through your fingers.
→ Learn how StealthScalp automates your futures edge »
Summary: The Doji Candlestick Pattern in Futures Trading
The doji candlestick pattern is a fundamental building block of price action analysis. But like all tools, it's only as good as the hand that wields it.
Here's what to take away:
- A doji forms when open ≈ close — representing market indecision
- There are 5 types: standard, long-legged, dragonfly, gravestone, and four-price
- Dragonfly = bullish rejection; Gravestone = bearish rejection; Long-legged = volatility warning
- Always confirm with the following candle, volume, and structural context
- In futures, the highest-probability setups occur at VWAP, prior day highs/lows, and key moving averages
- Risk is naturally defined by the doji's wick extremes
Master the context, confirm the signal, define your risk, and execute without hesitation. Or better yet — let the algorithm do it.
Ready to stop watching setups and start capturing them? StealthScalp runs 24/5 in NinjaTrader 8 — no watching required. See it in action »