Divergence Cheat Sheet: Every Type Explained (With Tables & Settings)

What Is Divergence in Trading?
Divergence occurs when the price of an asset moves in one direction while a momentum oscillator (like RSI, MACD, or Stochastic) moves in the opposite direction. It's one of the most reliable signals available to technical traders — a heads-up that the current trend is losing steam and a reversal may be coming.
This cheat sheet covers every divergence type you need to know: Regular, Hidden, and Exaggerated — plus indicator settings, scanning tips, and common mistakes to avoid.
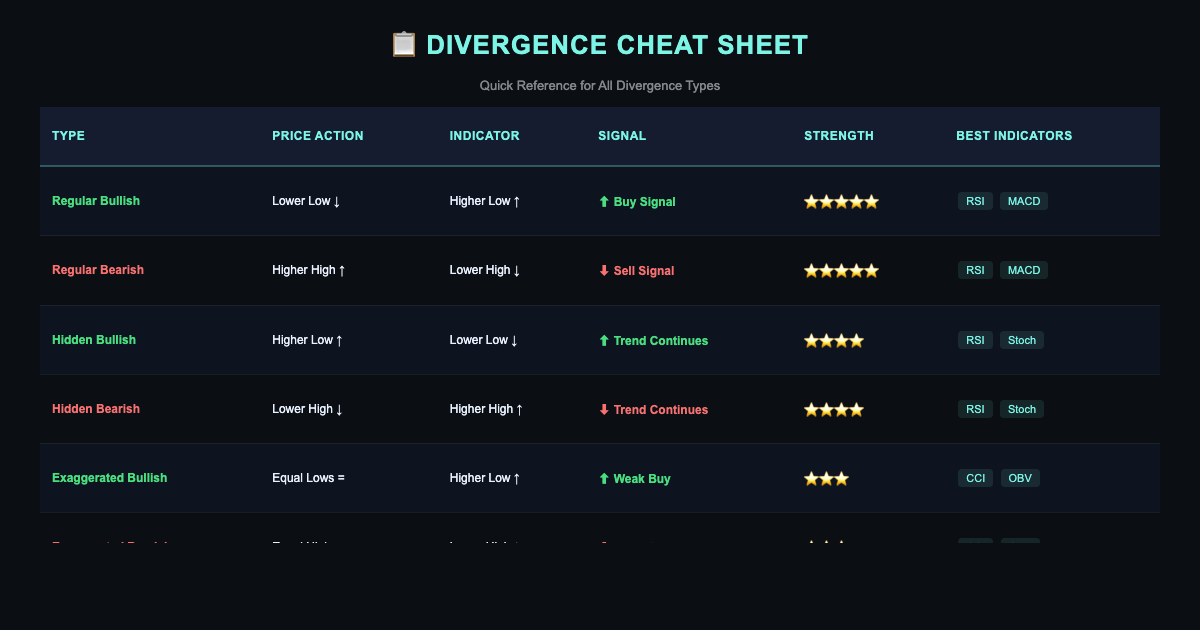
The 4 Core Divergence Types (Quick-Reference Table)
| Type | Price Action | Oscillator | Signal | Strength |
|---|---|---|---|---|
| Regular Bullish | Lower Low | Higher Low | Potential Upside Reversal | ⭐⭐⭐⭐⭐ |
| Regular Bearish | Higher High | Lower High | Potential Downside Reversal | ⭐⭐⭐⭐⭐ |
| Hidden Bullish | Higher Low | Lower Low | Trend Continuation (Up) | ⭐⭐⭐⭐ |
| Hidden Bearish | Lower High | Higher High | Trend Continuation (Down) | ⭐⭐⭐⭐ |
💡 Pro tip: Regular divergence signals reversals. Hidden divergence signals continuation. Knowing which is which is the difference between fading a trend and riding it.
Regular Divergence (Reversal Signals)
🟢 Regular Bullish Divergence
What to look for:
- Price makes a lower low (new swing low below the previous one)
- Oscillator makes a higher low (momentum doesn't confirm the new low)
- Usually forms at the end of a downtrend or during a pullback
What it means: Selling pressure is weakening even as price continues lower. Buyers are quietly stepping in. Expect a potential reversal to the upside.
Best timeframes: Works on all timeframes — most reliable on 15-min and above for swing traders; 3-min and 5-min for intraday scalpers.
Confirmation signals:
- Bullish candlestick pattern at the second low (hammer, engulfing, pin bar)
- Price reclaims a key support level
- RSI crosses back above 30 (oversold exit)
- Volume spike on the reversal candle
🔴 Regular Bearish Divergence
What to look for:
- Price makes a higher high (new swing high above the previous one)
- Oscillator makes a lower high (momentum is fading at the new high)
- Usually forms at the top of an uptrend or a relief rally
What it means: Buying pressure is exhausting. Price is pushing higher on fumes. A bearish reversal or significant pullback is likely.
Confirmation signals:
- Bearish candlestick pattern at the second high (shooting star, bearish engulfing, evening star)
- Price fails to hold above resistance
- RSI crosses below 70 (overbought exit)
- Volume declining on the second high push
Hidden Divergence (Continuation Signals)
🟢 Hidden Bullish Divergence
What to look for:
- Price makes a higher low (pullback doesn't break the previous swing low)
- Oscillator makes a lower low (appears oversold, but trend is still up)
- Forms during a pullback in an uptrend
What it means: The uptrend is intact. The pullback is healthy and buyers are maintaining control. Price is likely to resume its upward move.
Best use case: Enter on pullbacks within a confirmed uptrend. Hidden bullish divergence is a trend-follower's best friend — it identifies low-risk entries with trend continuation potential.
🔴 Hidden Bearish Divergence
What to look for:
- Price makes a lower high (bounce doesn't reach the previous swing high)
- Oscillator makes a higher high (appears overbought, but trend is still down)
- Forms during a bounce in a downtrend
What it means: The downtrend is intact. The bounce is just a relief rally. Sellers remain in control and price is likely to resume its move lower.
Best use case: Short entries on bounces within a confirmed downtrend. Hidden bearish divergence confirms the trend and discourages premature long entries.
Exaggerated Divergence (Class B & C)
Beyond regular and hidden, some traders classify exaggerated divergence by signal strength:
| Class | Price | Oscillator | Signal Quality |
|---|---|---|---|
| Class A (Regular) | New High/Low | Fails to confirm | ✅ Strongest — trade these |
| Class B (Exaggerated) | Double Top/Bottom | Lower high / Higher low | ⚠️ Moderate — use with confluence |
| Class C (Weak) | New High/Low | Flat (double top/bottom) | ❌ Weakest — generally ignore |
Takeaway: Focus on Class A divergences. Class B can work with strong confluence. Class C usually signals sideways/choppy action — not worth the risk.
Best Indicators for Spotting Divergence
RSI (Relative Strength Index) — Most Popular
Recommended settings:
- Period: 14 (standard) or 9 (more sensitive for scalping)
- Overbought level: 70
- Oversold level: 30
- Best for: Regular (reversal) divergence — look for divergences when RSI is near extremes (above 70 or below 30)
RSI divergence tip: The most powerful RSI divergence signals come when RSI is in oversold territory for bullish setups and overbought territory for bearish setups. Divergences in the middle (40-60 range) are often noise.
MACD (Moving Average Convergence Divergence)
Recommended settings:
- Fast EMA: 12
- Slow EMA: 26
- Signal Line: 9
- Best for: Trend-based divergence, especially on higher timeframes (1H, 4H, Daily)
MACD divergence tip: Use the MACD histogram for divergence, not just the MACD line. Histogram divergence often gives earlier signals than the line itself.
Stochastic Oscillator
Recommended settings:
- %K Period: 14
- %D Period: 3
- Smooth: 3
- Overbought: 80 | Oversold: 20
- Best for: Short-term and intraday divergence signals, especially in ranging markets
CCI (Commodity Channel Index)
Recommended settings:
- Period: 20
- Overbought: +100 | Oversold: -100
- Best for: Catching divergence in commodity and futures markets; also excellent for ES, NQ, and crude oil
OBV (On-Balance Volume)
Recommended settings: Default (no parameters needed)
- Best for: Volume-based divergence — confirms if price moves are backed by real buying/selling pressure or are just price manipulation
- OBV divergence is especially powerful when combined with RSI divergence
Divergence Cheat Sheet: Indicator Comparison
| Indicator | Best Divergence Type | Timeframe | Markets |
|---|---|---|---|
| RSI (14) | Regular (Reversal) | Any | Stocks, Futures, Forex, Crypto |
| MACD (12/26/9) | Regular + Hidden | 1H+ | Stocks, Futures, Forex |
| Stochastic (14/3/3) | Regular (Reversal) | 5-min to Daily | Any liquid market |
| CCI (20) | Regular + Hidden | Any | Futures, Commodities |
| OBV | Volume Divergence | 1H+ | Stocks, Crypto |
How to Trade Divergence: Step-by-Step
- Identify the trend — Is price in an uptrend, downtrend, or range? This determines whether you're looking for reversal (regular) or continuation (hidden) divergence.
- Find the divergence — Compare swing highs/lows on price with corresponding highs/lows on your oscillator.
- Wait for confirmation — Never trade divergence alone. Wait for a confirming candlestick pattern, a break of a short-term trendline, or an oscillator crossing a key level.
- Place your entry — Enter on confirmation, not anticipation. Aggressive traders enter on the close of the confirmation candle; conservative traders wait for a pullback entry.
- Set your stop — Place your stop loss just beyond the divergence swing high/low (the point that would invalidate the signal).
- Define your target — Use the nearest significant support/resistance level, a Fibonacci retracement level, or a 1:2 risk-reward minimum.
Common Divergence Mistakes (And How to Avoid Them)
❌ Mistake 1: Trading Every Divergence
Not every divergence leads to a reversal. Always require confluence — at least 2 confirming factors before taking a trade.
❌ Mistake 2: Ignoring the Higher Timeframe
A bullish divergence on a 1-minute chart means little if the daily chart is in a strong downtrend. Always check the higher timeframe first.
❌ Mistake 3: Comparing Non-Corresponding Pivots
You must compare the same type of pivot — price low to oscillator low, price high to oscillator high. Never compare a price high to an oscillator low.
❌ Mistake 4: Trading Without a Stop
Divergence signals fail regularly — especially in strong trends. Every divergence trade needs a clearly defined stop loss.
❌ Mistake 5: Using Too Many Indicators
Pick one primary oscillator and stick with it. Using RSI, MACD, and Stochastic simultaneously often leads to contradictory signals and analysis paralysis.
Divergence + Automation: Never Miss a Signal Again
Spotting divergence manually is time-consuming — you're watching multiple instruments across multiple timeframes, looking for specific oscillator patterns while managing existing trades.
That's exactly why StealthScalp was built. It's an automated trading bot for NinjaTrader 8 that handles the pattern recognition and execution for you — no more staring at charts waiting for a setup to materialize.
StealthScalp monitors the market 24/5, identifies high-probability setups using built-in momentum logic, and executes entries and exits automatically with pre-configured risk management. If you're serious about trading divergence (or any momentum-based strategy) without being chained to your screen, it's worth a look.
👉 Explore StealthScalp — Automated Trading for NinjaTrader 8
Quick-Reference Summary: Divergence Cheat Sheet
| Signal | Price | Oscillator | Action | Stop Placement |
|---|---|---|---|---|
| Regular Bullish | Lower Low ↘ | Higher Low ↗ | Look to buy | Below the second low |
| Regular Bearish | Higher High ↗ | Lower High ↘ | Look to sell | Above the second high |
| Hidden Bullish | Higher Low ↗ | Lower Low ↘ | Buy the pullback | Below the higher low |
| Hidden Bearish | Lower High ↘ | Higher High ↗ | Sell the bounce | Above the lower high |
Final Thoughts
Divergence is one of the most powerful concepts in technical analysis — not because it's complex, but because it gives you an early warning before price confirms the move. That edge is everything in trading.
Use this cheat sheet as your go-to reference:
- Regular divergence = potential reversal
- Hidden divergence = trend continuation
- Class A signals = highest quality setups
- Always confirm before entering
- RSI (14) or MACD (12/26/9) are your best tools
Bookmark this page, print it, pin it to your monitor. The traders who master divergence tend to trade less — and profit more.
And if you're ready to stop doing it all manually, StealthScalp for NinjaTrader 8 has you covered.