Confluence Trading: How to Stack the Odds in Your Favor on Every Trade

Most traders lose money not because they lack a strategy — but because they take trades based on a single signal and wonder why it keeps failing.
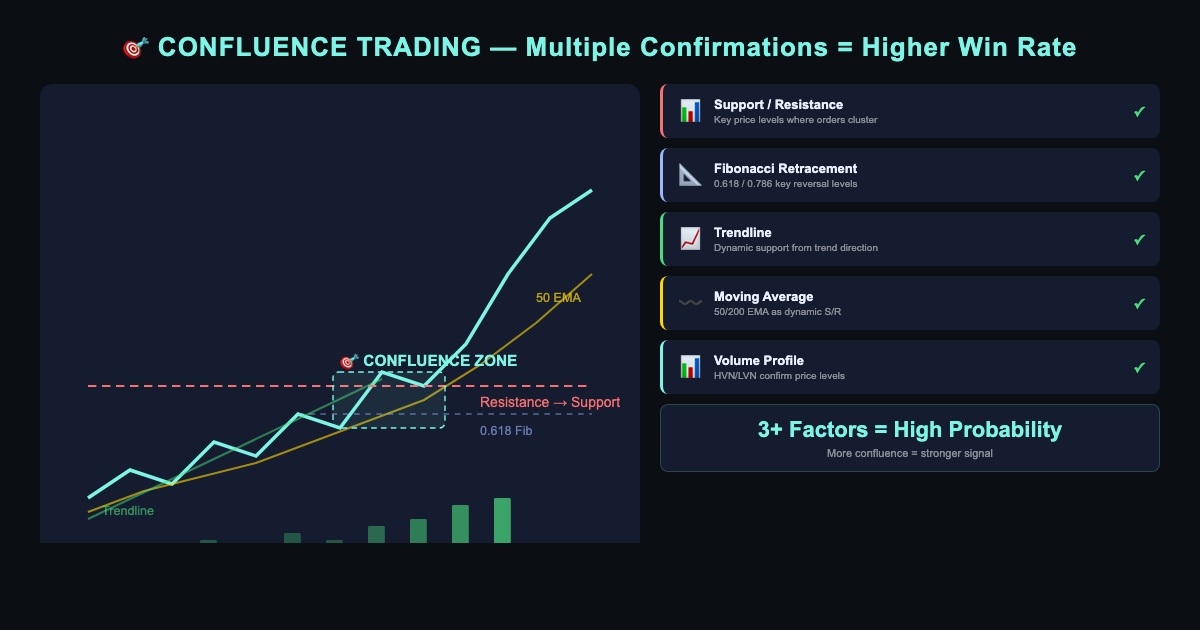
Confluence trading fixes that. It's the practice of stacking multiple technical factors at the same price level before pulling the trigger. When three, four, or five different tools all point to the same zone, you're no longer guessing. You're trading with evidence.
This guide breaks down exactly what confluence is, the five types every futures trader should know, and a step-by-step process for finding high-probability confluence zones on ES and NQ.
What Is Confluence in Trading?
Confluence in trading means the alignment of two or more technical signals at the same price level — signals that independently would suggest a trade, but together create a significantly stronger setup.
Think of it like a courtroom. One witness saying you were at the scene isn't enough for a conviction. But five independent witnesses, camera footage, and a phone record? That's a different story.
Trading confluence works the same way. When a Fibonacci retracement level, a major support zone, a moving average, and a trendline all meet at 5,250 on the ES — that's not a coincidence. That's a zone worth paying attention to.
Confluence doesn't guarantee a winner. But it dramatically reduces false signals and improves your risk-to-reward by giving you entries with logical, defensible invalidation points.
Why Single-Signal Trading Fails
If you've traded off a single moving average cross or a single RSI reading, you've felt the pain firsthand. The signal fires, you enter, price immediately reverses and stops you out — and then reverses again in your original direction.
This is noise. Markets are designed to shake out weak hands.
When you require multiple signals to align before entering, you filter out the majority of false setups. The trades you take become fewer, but they're higher quality. That's the core promise of how to use confluence trading effectively.
5 Types of Confluence Every Futures Trader Needs
1. Support and Resistance Levels
Support and resistance are the foundation of confluence analysis. These are price levels where the market has previously reversed, consolidated, or reacted sharply — and they tend to act as magnets again.
On the ES (S&P 500 futures), look for:
- Prior day high/low — the most watched levels by institutional traders
- Weekly and monthly highs/lows — key levels for swing and position traders
- Round numbers — 5,000; 5,100; 5,200 attract massive order flow
2. Fibonacci Retracement Levels
The Fibonacci retracement tool draws horizontal lines at the key ratios (23.6%, 38.2%, 50%, 61.8%, 78.6%) between a swing high and swing low. The 61.8% level — called the "golden ratio" — is particularly powerful.
When a Fibonacci level coincides with a support/resistance zone, the probability of a reaction increases significantly. Institutions know where these levels are. They use them. You should too.
For ES and NQ trades, draw Fibonacci retracements on the hourly and 4-hour charts for intraday confluence, and the daily chart for swing trade setups.
3. Trendlines
A trendline connects a series of higher lows (in an uptrend) or lower highs (in a downtrend). When price pulls back to a trendline that sits at the same level as a support zone and a Fibonacci level, you've stacked three layers of confluence.
Trendlines work best when they've been touched three or more times. The more touches, the more valid the line — and the more traders are watching it.
On NQ (Nasdaq futures), diagonal trendlines from major swing lows are especially significant because the index trends more aggressively than ES.
4. Moving Averages
Moving averages smooth price action and highlight dynamic support and resistance. The most widely watched in futures:
- 20 EMA — short-term momentum reference
- 50 SMA — institutional benchmark for intermediate trend
- 200 SMA — the ultimate long-term trend indicator
When price pulls back to the 50 SMA on the 1-hour chart, and that SMA happens to sit at a Fibonacci 61.8% and a prior day high — you've got one of the strongest confluence setups in trading.
5. Volume and Volume Profile
Volume is the only leading indicator that shows you where real money is being committed. High-volume nodes on the Volume Profile represent price areas where institutions have traded heavily — and these levels tend to act as support or resistance on revisits.
On the ES, look for:
- Point of Control (POC) — the highest volume node of the session
- High Volume Nodes (HVN) — areas of price acceptance where reversals occur
- Low Volume Nodes (LVN) — areas price tends to move through quickly
Step-by-Step Process for Finding Confluence Zones
Here's the exact process to build a confluence map before each trading session:
Step 1: Mark Your Key S/R Levels
Start with the daily chart. Mark prior day high, low, and close; prior week high and low; and major psychological round numbers within 1-2% of current price. These are your anchor points.
Step 2: Draw Fibonacci Retracements
Identify the most recent significant swing high and swing low on the 4-hour or daily chart. Apply your Fibonacci retracement tool and mark the 38.2%, 50%, 61.8%, and 78.6% levels. Do this for both the most recent swing and any larger macro swing still in play.
Step 3: Add Your Moving Averages
Drop down to the 1-hour chart and overlay the 20 EMA, 50 SMA, and 200 SMA. Note where each is sitting and whether price is above or below each one. If the 50 SMA is approaching a Fibonacci level and a prior day high — that's a zone to watch.
Step 4: Draw Active Trendlines
On the 1-hour and 4-hour charts, draw the dominant trendlines connecting the most recent swing highs (for downtrends) or swing lows (for uptrends). Note where these trendlines project to in the coming hours.
Step 5: Check Volume Profile
Add the Volume Profile for the current session or week. Identify the Point of Control and any major High Volume Nodes near your confluence areas.
Step 6: Score Your Zones
Rate each zone by how many factors are present:
- 1-2 factors: Low-confidence zone — skip it
- 3 factors: Moderate confluence — consider if risk/reward is 1:2 or better
- 4+ factors: High confluence — this is your A+ setup
Only trade the high-confluence zones. Everything else is noise.
Real Examples: Confluence on ES and NQ
ES Example: The 5,200 Bounce
Imagine ES is pulling back from a recent high of 5,310. You run through your process:
- S/R: 5,200 is a major psychological round number and prior week high
- Fibonacci: The 61.8% retracement of the recent swing sits at 5,198
- Moving Average: The 50 SMA on the 1-hour chart is at 5,203
- Volume Profile: The POC from the previous week's session is at 5,200
- Trendline: The ascending trendline from the prior major swing low touches 5,197
Five factors stacking at 5,197–5,203. That's not coincidence — that's a high-confluence zone worth trading. You'd look for a bullish confirmation candle (engulfing, hammer, or pin bar) on the 5-minute chart before entering long.
NQ Example: The 18,500 Rejection
NQ has been grinding higher and is approaching 18,500. Your analysis shows:
- S/R: 18,500 is a prior monthly high that capped price twice before
- Fibonacci: The 100% Fibonacci extension of the recent impulse leg hits 18,497
- Moving Average: The 20 EMA on the 4-hour chart is beginning to slope flat near 18,505
- Volume Profile: A Low Volume Node sits above — meaning price is likely to reject and fill lower
Four-factor confluence at resistance. You'd look for a bearish confirmation candle and enter short with a stop above 18,550 and a target at the next support zone.
Why Confluence Reduces False Signals
False signals occur when a single indicator fires in isolation while the broader market context disagrees. Here's the contrast:
Without confluence: The RSI hits oversold → you buy → price continues lower → stopped out.
With confluence: The RSI hits oversold and price is at the Fibonacci 61.8% and the 50 SMA and a prior support level → multiple independent reasons to expect a bounce → higher probability entry.
Each additional confluent factor acts as a filter. You're not looking for more signals to take more trades — you're using them to take better trades. Fewer entries, higher win rate, larger average winner.
Want Confluence Entries Executed Automatically?
Identifying confluence zones manually takes practice. But executing the trade — catching the exact moment the zone holds — requires precision that's hard to achieve in fast-moving futures markets like ES and NQ.
That's why serious futures traders use StealthScalp — an automated NinjaTrader 8 trading bot built specifically for the S&P 500 and Nasdaq futures. StealthScalp monitors pre-defined confluence zones and executes entries with exact stop placement the moment price confirms, removing emotion and hesitation from the equation.
👉 Learn more about StealthScalp → trinitytrading.io
Common Mistakes in Confluence Trading
Mistake 1: Forcing confluence. Not every trade will have 4-5 factors. Don't stretch your analysis to make a mediocre setup look better. Be selective.
Mistake 2: Using correlated indicators. MACD and RSI both measure momentum — using both isn't "two factors," it's one factor measured twice. True confluence comes from different types of tools: price structure, Fibonacci, moving averages, and volume.
Mistake 3: Ignoring the trend. Even the best confluence zone can fail if you're trading against the dominant trend. Always know whether you're looking for longs or shorts based on the higher timeframe trend.
Mistake 4: No confirmation candle. Don't enter the moment price touches a confluence zone. Wait for a confirmation candle — a bullish engulfing, hammer, or pin bar at support; a bearish engulfing or shooting star at resistance.
Final Thoughts on Confluence Trading
Confluence trading isn't a magic formula. It's a discipline — a commitment to only taking trades where multiple independent factors agree.
The traders who master this approach don't need to trade every day. They wait for setups where the odds are clearly in their favor, take the trade with confidence, and manage it cleanly.
For futures traders on ES and NQ, confluence zones are especially powerful because these markets attract massive institutional participation. Institutions cluster their orders around the same key levels — S/R, Fibonacci, moving averages — which is precisely why these zones work.
Start with two factors. Then add a third. Build your eye for where multiple tools converge. Over time, you'll develop the ability to spot high-confluence zones quickly — and that's when your trading will change.
Want confluence-based entries executed automatically — with zero hesitation? StealthScalp runs 24/5 on NinjaTrader 8, targeting the highest-probability zones on ES and NQ so you never miss a clean setup. Try it risk-free at trinitytrading.io.