Chart Pattern Cheatsheet: Every Major Pattern Every Trader Needs to Know
The most complete chart pattern cheatsheet for traders. Every major reversal and continuation pattern with entry signals, exit targets, stop placement, and reliability ratings.

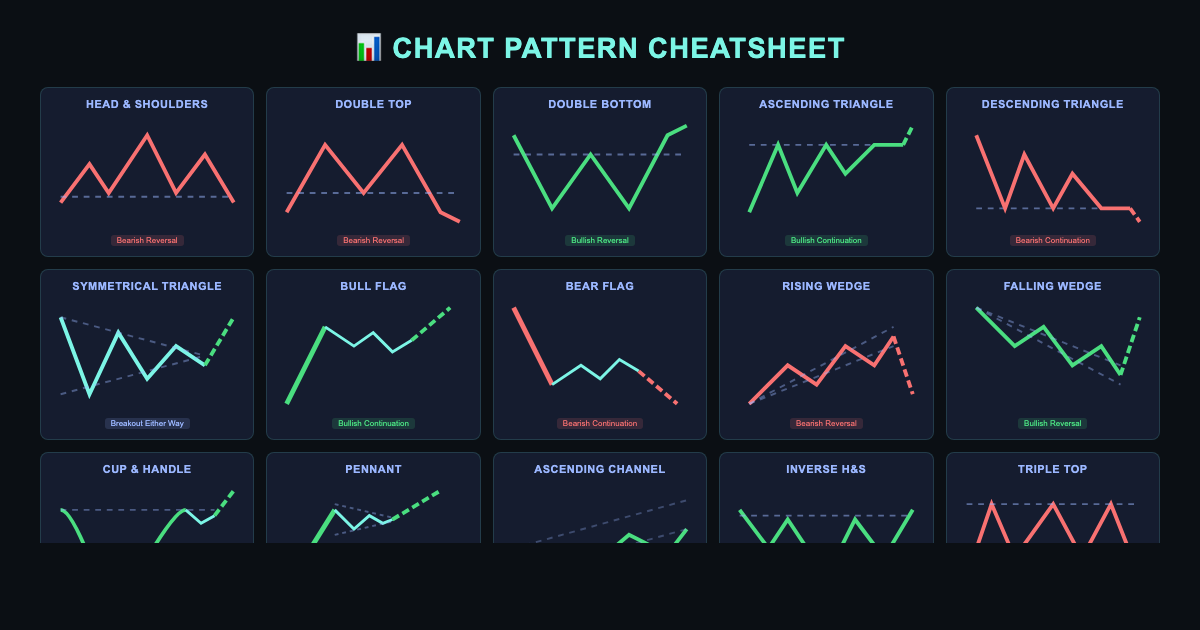
Chart Pattern Cheatsheet: Every Major Pattern Every Trader Needs to Know
Chart patterns are the language of price action. They're the visual footprints left behind by institutional money, retail traders, market makers, and algorithms — all of them jostling for position in real time. If you can read these patterns fluently, you gain a significant edge over traders who are just chasing candles.
This is the most complete chart pattern cheatsheet you'll find. We've organized every major pattern into clear categories — reversal patterns and continuation patterns — with entry signals, exit targets, stop placement, and a reliability rating for each. Bookmark this page. You'll come back to it.
What Are Chart Patterns?
A chart pattern is a recognizable shape formed by a stock's price over time. These shapes repeat because human psychology repeats — fear, greed, indecision, and capitulation manifest in predictable ways on a chart.
Patterns are broadly split into two families:
- Reversal patterns — signal the current trend is ending and price is likely to move in the opposite direction
- Continuation patterns — signal the current trend is pausing before resuming in the same direction
Volume is your confirmation tool. A breakout with low volume is a warning sign. A breakout with above-average volume is a green light. Always factor in the broader market context and timeframe when trading any pattern.
Let's get into it.
Reversal Patterns
Reversal patterns form at the end of trends. They signal exhaustion — buyers running out of steam at a top, or sellers capitulating at a bottom.
1. Head and Shoulders (Bearish)
The head and shoulders pattern is one of the most recognized and reliable reversal signals in technical analysis. It forms at the end of an uptrend and signals a shift from bullish to bearish momentum.
Structure:
- Left shoulder: Price rallies to a high, then pulls back
- Head: Price rallies to a higher high, then pulls back again
- Right shoulder: Price rallies to a lower high (roughly equal to the left shoulder), then pulls back
- Neckline: A support line drawn connecting the two lows between the shoulders
What it signals: Trend reversal from bullish to bearish. The right shoulder's failure to reach the head's high signals weakening buying pressure.
Entry: Enter short on a confirmed break below the neckline. Wait for a candle to close below — not just wick through.
Stop loss: Above the right shoulder high.
Price target: Measure the distance from the head to the neckline, then project that distance downward from the breakout point.
Reliability rating: ⭐⭐⭐⭐⭐ (High) — One of the highest-probability reversal patterns when accompanied by volume confirmation (volume should be higher on the left shoulder than the right).
2. Inverse Head and Shoulders (Bullish)
The inverse head and shoulders is the mirror image of the classic pattern — it forms at the end of a downtrend and signals a bullish reversal.
Structure: Same as above, but flipped. Left shoulder (low), head (lower low), right shoulder (higher low than head).
Entry: Long on a confirmed break and close above the neckline.
Stop loss: Below the right shoulder low.
Price target: Distance from head to neckline, projected upward from breakout.
Reliability rating: ⭐⭐⭐⭐⭐ (High)
3. Double Top (Bearish)
The double top forms after an extended uptrend when price tests a resistance level twice but fails to break through, then reverses lower. It looks like the letter "M" on a chart.
What it signals: The market tested a price level twice and couldn't break it. Sellers are in control. Expect a downside move.
Entry: Short on a break below the support level (the swing low between the two tops), also called the confirmation level.
Stop loss: Above the double top highs.
Price target: Distance from the tops to the confirmation level, projected downward from the breakout.
Reliability rating: ⭐⭐⭐⭐ (Good) — More reliable when the two tops form at the same price level with a clear pullback in between.
4. Double Bottom (Bullish)
The double bottom is the bullish mirror of the double top. It looks like the letter "W" and forms when price tests a support level twice, fails to break lower, and reverses upward.
Entry: Long on a break above the confirmation level (the swing high between the two bottoms).
Stop loss: Below the double bottom lows.
Price target: Distance from the bottoms to the confirmation level, projected upward.
Reliability rating: ⭐⭐⭐⭐ (Good)
5. Triple Top (Bearish)
The triple top is similar to a double top but tests the resistance level three times before reversing. It signals even stronger resistance at that level — sellers have defended the zone on multiple occasions.
Entry: Short on a break below the lowest point between the three tops.
Stop loss: Above the triple top highs.
Price target: Height of the pattern projected downward from the breakout.
Reliability rating: ⭐⭐⭐⭐ (Good) — The more times price tests a level without breaking through, the stronger that level is — until it isn't.
6. Triple Bottom (Bullish)
The mirror of the triple top, forming after a downtrend. Three failed attempts to break support signal a strong reversal.
Entry: Long on a break above the highest point between the three lows.
Stop loss: Below the triple bottom lows.
Reliability rating: ⭐⭐⭐⭐ (Good)
7. Rising Wedge (Bearish)
The rising wedge is a deceptive pattern — price is moving higher, but it's doing so with decreasing momentum. Both trendlines slope upward, but the upper trendline is flatter than the lower. Price is being squeezed upward with diminishing energy.
What it signals: Bearish reversal or continuation of a downtrend (if it forms during a retracement).
Entry: Short on a break below the lower trendline of the wedge.
Stop loss: Above the most recent swing high inside the wedge.
Price target: The height of the wedge at its widest point, projected downward from the breakout.
Reliability rating: ⭐⭐⭐⭐ (Good) — Watch for declining volume as price rises within the wedge — a classic sign that the move is running out of steam.
8. Falling Wedge (Bullish)
The falling wedge is the bullish counterpart. Price contracts downward with both trendlines sloping lower, but the lower trendline is less steep. Volume typically contracts as the pattern develops.
Entry: Long on a break above the upper trendline of the wedge.
Stop loss: Below the most recent swing low inside the wedge.
Price target: Height of the wedge at its widest point, projected upward.
Reliability rating: ⭐⭐⭐⭐ (Good) — One of the more reliable bullish reversal patterns, especially when it forms as a retracement within a larger uptrend.
9. Rounding Bottom (Bullish)
The rounding bottom (also called a "saucer bottom") is a gradual, curved reversal pattern that forms over a long period. It represents a slow transition from bearish to bullish sentiment — no sharp V-reversal, just a steady shift in control from sellers to buyers.
Entry: Long when price breaks above the rim of the saucer (the resistance line connecting both ends of the pattern).
Stop loss: Below the lowest point of the rounding bottom.
Price target: Depth of the pattern projected upward from the breakout.
Reliability rating: ⭐⭐⭐ (Moderate) — Reliable but slow to develop. Better suited to swing and position traders than scalpers.
Continuation Patterns
Continuation patterns form when a trending market pauses to consolidate before resuming in the same direction. Think of them as the market catching its breath before the next leg of the move.
10. Bull Flag (Bullish)
The bull flag is one of the most powerful continuation patterns in a trader's arsenal. It forms after a sharp, nearly vertical price surge (the flagpole), followed by a tight, orderly consolidation that drifts slightly lower or sideways (the flag).
What it signals: The initial surge was a strong momentum move. The consolidation is healthy — not a reversal. Expect a breakout to the upside.
Entry: Long on a break above the upper boundary of the flag channel. Wait for volume to confirm.
Stop loss: Below the lowest point of the flag.
Price target: Length of the flagpole added to the breakout point.
Reliability rating: ⭐⭐⭐⭐⭐ (High) — Bull flags are extremely high-probability when volume drops during the flag formation and surges on the breakout. This is exactly the type of momentum pattern that StealthScalp was built to automate — the bot identifies flagpole momentum, tracks the consolidation, and fires entries at the breakout with precision timing.
11. Bear Flag (Bearish)
The mirror of the bull flag. A sharp drop (flagpole) followed by a tight, drifting consolidation upward or sideways (flag) before another leg down.
Entry: Short on a break below the lower boundary of the flag.
Stop loss: Above the highest point of the flag.
Price target: Length of the flagpole subtracted from the breakout point.
Reliability rating: ⭐⭐⭐⭐⭐ (High)
12. Bull Pennant (Bullish)
The bull pennant is similar to the bull flag but the consolidation forms a symmetrical triangle (converging trendlines) rather than a channel. It's a tighter, sharper consolidation pattern.
Entry: Long on a break above the upper trendline of the pennant.
Stop loss: Below the lowest point of the pennant.
Price target: Length of the flagpole added to the breakout point.
Reliability rating: ⭐⭐⭐⭐ (Good)
13. Bear Pennant (Bearish)
The bearish counterpart to the bull pennant — sharp drop followed by a converging triangle consolidation before continuation lower.
Entry: Short on a break below the lower trendline of the pennant.
Stop loss: Above the highest point of the pennant.
Price target: Flagpole length subtracted from the breakout point.
Reliability rating: ⭐⭐⭐⭐ (Good)
14. Ascending Triangle (Bullish Bias)
The ascending triangle features a flat top (horizontal resistance) and a rising lower trendline (higher lows). Buyers are getting more aggressive — each pullback is shallower than the last — but sellers are defending a specific level.
What it signals: Usually a bullish continuation (in an uptrend). The flat top represents a supply zone. When buyers finally overpower sellers, price can burst through with force.
Entry: Long on a break and close above the flat resistance level, ideally with strong volume.
Stop loss: Below the most recent higher low inside the triangle.
Price target: Height of the triangle at its widest point, added to the breakout level.
Reliability rating: ⭐⭐⭐⭐ (Good) — Can also resolve bearish (breakdown), so always wait for confirmed direction.
15. Descending Triangle (Bearish Bias)
The descending triangle is the inverse — a flat support level being tested multiple times while the upper trendline slopes lower (lower highs). Sellers are getting more aggressive with each bounce.
Entry: Short on a break below the flat support level with volume confirmation.
Stop loss: Above the most recent lower high inside the triangle.
Price target: Height of the triangle at its widest point, subtracted from the breakdown level.
Reliability rating: ⭐⭐⭐⭐ (Good)
16. Symmetrical Triangle (Neutral)
The symmetrical triangle forms when price is making lower highs and higher lows simultaneously — converging into a point. Neither bulls nor bears are in control. The breakout direction determines the trade.
Entry: In the direction of the breakout (above upper trendline = long; below lower trendline = short).
Stop loss: On the opposite side of the triangle from your entry.
Price target: Height of the widest part of the triangle, projected from the breakout point.
Reliability rating: ⭐⭐⭐ (Moderate) — The pattern itself doesn't give you direction. Your edge comes from context: what's the prevailing trend? What's the broader market doing? Trade the breakout in the direction of least resistance.
17. Cup and Handle (Bullish)
The cup and handle is a longer-term bullish continuation pattern made famous by William O'Neil. It forms over weeks or months, making it more reliable than shorter-term patterns.
Structure:
- Cup: A rounded, U-shaped pullback from a prior high — NOT a V-shape. The gradual rounding indicates a slow, healthy transition back to bullish momentum.
- Handle: After the cup forms and price returns near the prior high, a smaller pullback or sideways drift occurs (the handle). This shakes out weak hands before the breakout.
Entry: Long on a break above the handle's resistance level (the high point of the handle).
Stop loss: Below the lowest point of the handle.
Price target: Depth of the cup added to the breakout point.
Reliability rating: ⭐⭐⭐⭐⭐ (High) — One of the most reliable intermediate-term bullish patterns. Institutional accumulation often drives the cup formation.
18. Broadening Formation / Megaphone (Volatile)
The broadening formation (also called a megaphone pattern) is the opposite of a triangle — price makes higher highs and lower lows simultaneously, with trendlines expanding outward. It signals increasing volatility and market indecision.
What it signals: Often appears at market tops and can signal a reversal, but it's inherently unpredictable. Treat this as a high-volatility, high-risk environment.
Entry: Trade the extremes — short near the upper trendline, long near the lower trendline — with tight stops. Breakouts from broadening formations tend to be violent.
Reliability rating: ⭐⭐ (Low-Moderate) — Use with caution and reduced position size.
19. Rectangle (Neutral Continuation)
The rectangle pattern (also called a trading range or channel consolidation) forms when price bounces between two parallel horizontal levels — a clear support and resistance zone. It's the simplest consolidation pattern.
Entry: Trade the breakout in the direction of the prevailing trend. In an uptrend, buy the break above resistance. In a downtrend, sell the break below support.
Stop loss: Inside the rectangle, opposite the breakout direction.
Price target: Height of the rectangle added/subtracted from the breakout point.
Reliability rating: ⭐⭐⭐ (Moderate)
The Most Reliable Chart Patterns Ranked
Not all patterns are created equal. Here's a quick reference ranking by historical reliability:
| Pattern | Type | Direction | Reliability |
|---|---|---|---|
| Head & Shoulders | Reversal | Bearish | ⭐⭐⭐⭐⭐ |
| Inverse Head & Shoulders | Reversal | Bullish | ⭐⭐⭐⭐⭐ |
| Cup and Handle | Continuation | Bullish | ⭐⭐⭐⭐⭐ |
| Bull Flag | Continuation | Bullish | ⭐⭐⭐⭐⭐ |
| Bear Flag | Continuation | Bearish | ⭐⭐⭐⭐⭐ |
| Double Top | Reversal | Bearish | ⭐⭐⭐⭐ |
| Double Bottom | Reversal | Bullish | ⭐⭐⭐⭐ |
| Ascending Triangle | Continuation | Bullish Bias | ⭐⭐⭐⭐ |
| Descending Triangle | Continuation | Bearish Bias | ⭐⭐⭐⭐ |
| Falling Wedge | Reversal | Bullish | ⭐⭐⭐⭐ |
| Rising Wedge | Reversal | Bearish | ⭐⭐⭐⭐ |
| Bull Pennant | Continuation | Bullish | ⭐⭐⭐⭐ |
| Bear Pennant | Continuation | Bearish | ⭐⭐⭐⭐ |
| Symmetrical Triangle | Continuation | Neutral | ⭐⭐⭐ |
| Rectangle | Continuation | Neutral | ⭐⭐⭐ |
| Rounding Bottom | Reversal | Bullish | ⭐⭐⭐ |
| Broadening Formation | Reversal/Volatile | Neutral | ⭐⭐ |
How to Use Chart Patterns Effectively
Knowing the patterns is the first step. Using them profitably is a different skill. Here's what separates pattern traders who make money from those who get wrecked by false breakouts.
1. Wait for Confirmation
Never enter a trade based on an anticipated breakout. Wait for a candle to close beyond the key level — above resistance or below support. Wicks don't count. Close price does.
2. Volume Is Non-Negotiable
A breakout on low volume is a red flag. Institutional money drives real moves. When the big players are involved, volume surges. When they're not, you get fakeouts that trap retail traders on the wrong side.
Look for: Volume declining during consolidation, then expanding sharply at the breakout point.
3. Trade with the Trend
Continuation patterns in the direction of the trend outperform reversal patterns going against it. A bull flag in a strong uptrending stock is a higher-probability trade than a head and shoulders in a mild uptrend.
Always ask: What's the bigger picture? Is this pattern aligned with or against the trend?
4. Context Is Everything
The same pattern can be bullish or bearish depending on where it forms. A symmetrical triangle at all-time highs after a long uptrend is very different from one forming after a 30% crash. Pattern location matters.
5. Risk Management First
Define your risk before you enter the trade. Know exactly where your stop loss is and size your position so that if you're stopped out, you lose no more than 1-2% of your account. The pattern is irrelevant if you're betting the farm on a single trade.
6. False Breakouts Are Part of the Game
No pattern works 100% of the time. False breakouts happen — they're part of the market structure. Your edge comes from executing your setup consistently with proper risk management, not from finding the "perfect" pattern.
The Role of Timeframe in Pattern Trading
Chart patterns work on every timeframe — from 1-minute scalping charts to monthly investment charts. But the higher the timeframe, the more reliable the pattern.
- 1m - 5m charts: Patterns form quickly, break quickly, and have lower reliability. Requires extremely fast execution. This is the domain of the automated trader.
- 15m - 1h charts: Sweet spot for day traders. Patterns have enough structure to be meaningful without requiring multi-day holding periods.
- 4h - Daily charts: Swing trader territory. Higher-reliability patterns, larger targets, more breathing room on stops.
- Weekly - Monthly charts: Investment patterns. Cup and handles, multi-year head and shoulders. The highest reliability, lowest frequency.
For active day traders working the 1-minute to 15-minute charts, executing pattern-based trades with precision is incredibly difficult to do manually — especially when you need to track multiple instruments simultaneously. This is where automation becomes a competitive advantage.
StealthScalp is a fully automated NinjaTrader 8 trading bot that handles real-time pattern recognition, entry timing, stop placement, and exit management — so you can focus on strategy instead of execution. If you're tired of missing the exact entry on a bull flag breakout or second-guessing your stop, check out what StealthScalp can do for your trading.
Common Chart Pattern Mistakes to Avoid
Mistake 1: Seeing Patterns That Aren't There
Pattern recognition is a cognitive skill, and the human brain is very good at finding patterns — even in random data. Be disciplined: if you have to squint or stretch to see the pattern, it probably isn't a valid setup.
Mistake 2: Entering Too Early
Anticipating a breakout before it happens is one of the most common (and expensive) trading mistakes. The market has a way of punishing premature entries. Wait for confirmation.
Mistake 3: Ignoring the Broader Market
Even the best pattern on an individual stock can fail if the broader market is selling off hard. Check the SPY, QQQ, or relevant sector ETF before entering a pattern-based trade.
Mistake 4: No Stop Loss
Trading without a stop loss is gambling. Every pattern trade needs a defined stop. If the pattern invalidates — and the stop loss tells you when it has — exit without hesitation.
Mistake 5: Chasing the Breakout
You missed the entry. The stock broke out and ran 3% before you placed your order. Don't chase it. Wait for a retest of the breakout level, or move on to the next setup. There will always be another trade.
Quick Reference: Pattern Cheatsheet Summary
Reversal Patterns at a Glance
- Head & Shoulders — Bearish reversal at uptrend peak | Enter below neckline | Target = head-to-neckline distance
- Inverse H&S — Bullish reversal at downtrend bottom | Enter above neckline | Same target method
- Double Top — Bearish reversal, two equal highs | Enter below confirmation | Target = pattern height
- Double Bottom — Bullish reversal, two equal lows | Enter above confirmation | Target = pattern height
- Rising Wedge — Bearish reversal | Enter below lower trendline | Target = wedge height
- Falling Wedge — Bullish reversal | Enter above upper trendline | Target = wedge height
- Rounding Bottom — Slow bullish reversal | Enter above rim | Target = depth of cup
Continuation Patterns at a Glance
- Bull Flag — Bullish continuation | Enter above flag resistance | Target = flagpole length
- Bear Flag — Bearish continuation | Enter below flag support | Target = flagpole length
- Bull Pennant — Bullish continuation | Enter above pennant | Target = flagpole length
- Bear Pennant — Bearish continuation | Enter below pennant | Target = flagpole length
- Ascending Triangle — Bullish bias | Enter above flat resistance | Target = triangle height
- Descending Triangle — Bearish bias | Enter below flat support | Target = triangle height
- Symmetrical Triangle — Neutral, trade the breakout | Target = triangle height
- Cup and Handle — Bullish continuation | Enter above handle resistance | Target = cup depth
- Rectangle — Neutral, trade the breakout | Target = rectangle height
Final Thoughts
Chart patterns are a foundational skill for any serious trader — but they're just one piece of the puzzle. Context, volume, timeframe, and risk management are what transform a pattern from a shape on a screen into a profitable trade.
Study these patterns until you can identify them instantly. Then trade them with discipline: wait for confirmation, manage your risk, and never let a single trade define your session.
And if you want to take the execution side completely off your plate — letting an automated system handle the entry timing, position sizing, and exits while you focus on reading the market — explore what StealthScalp can do. It's a purpose-built NinjaTrader 8 automated trading bot designed for active traders who are serious about results.
Save this cheatsheet. Share it with a trader who needs it. And go find your next setup.