Candlestick Patterns Every Trader Must Know (The Ultimate Cheat Sheet)

Why Candlestick Patterns Still Matter in 2025
Candlestick charts have been used to predict price movements for over 200 years — and they're still one of the most powerful tools a trader can have. Whether you're trading futures, forex, or stocks, understanding what each candle communicates about market sentiment gives you a critical edge.
Each candle tells a story: who controlled price during that period, how hard they pushed, and whether the opposing side pushed back. Stack several candles together and you get a pattern — a signal that price is about to make a decision.
This guide covers the top 15+ candlestick patterns every trader must know, organized by category, with reliability ratings and the best timeframes to trade them on.
Candlestick Anatomy: A Quick Refresher
Before diving into patterns, let's make sure we're on the same page about what a candlestick shows:
- Body — The range between the open and close price
- Wick / Shadow — The lines above/below the body showing the high and low
- Bullish candle — Close is higher than the open (typically green or white)
- Bearish candle — Close is lower than the open (typically red or black)
The size of the body and wicks is just as important as the pattern itself. A long body signals conviction. A long wick signals rejection. Knowing this unlocks every pattern below.
🟢 Bullish Candlestick Patterns
Bullish patterns signal that buyers are taking control — often appearing at the end of a downtrend or at key support levels.
1. Hammer
The hammer is one of the most reliable reversal signals in trading. It has a small body near the top of the candle with a long lower wick — at least 2x the body length.
What it means: Sellers pushed price significantly lower during the session, but buyers stepped in hard and drove it back up. The bulls won the battle.
- Best timeframe: Daily, 4H, 1H
- Reliability: ⭐⭐⭐⭐ High — especially at support zones
- Confirmation: Next candle closes bullish
2. Inverted Hammer
The inverted hammer looks like an upside-down version — small body near the bottom with a long upper wick. It appears in downtrends and signals a potential reversal.
The long upper wick shows buyers tried to push price up, and while sellers brought it back down, the bearish momentum is fading. Buyers are showing up.
- Best timeframe: Daily, 4H
- Reliability: ⭐⭐⭐ Moderate — needs confirmation candle
- Confirmation: Bullish candle following, ideally with volume
3. Bullish Engulfing
The bullish engulfing is a two-candle pattern where a large green candle completely engulfs the prior red candle's body. This is one of the strongest reversal signals in technical analysis.
It shows that buying pressure completely overwhelmed the prior session's selling. The bigger the engulfing candle, the more significant the signal.
- Best timeframe: Daily, 4H, 1H
- Reliability: ⭐⭐⭐⭐⭐ Very High — especially after extended downtrends
- Confirmation: Strong volume on engulfing candle
4. Morning Star
The morning star is a powerful three-candle reversal pattern. It consists of: a large bearish candle → a small indecision candle (often a doji) → a large bullish candle that closes well into the first candle's body.
Think of it as the "dawn" after a bearish night. Sellers dominated, then hesitated, then buyers took over completely.
- Best timeframe: Daily, Weekly
- Reliability: ⭐⭐⭐⭐⭐ Very High — one of the most reliable reversal patterns
- Best context: At major support levels or oversold conditions
5. Bullish Harami
The bullish harami ("harami" means pregnant in Japanese) features a large bearish candle followed by a smaller bullish candle that fits entirely within the first candle's body.
It signals that bearish momentum is losing steam. The market is contracting — a reversal may follow.
- Best timeframe: Daily, 4H
- Reliability: ⭐⭐⭐ Moderate — weaker on its own, stronger with RSI divergence
6. Three White Soldiers
Three consecutive bullish candles with higher closes, each opening within the prior candle's body. Three white soldiers is a powerful continuation or reversal signal — it shows sustained, aggressive buying across multiple sessions.
- Best timeframe: Daily, Weekly
- Reliability: ⭐⭐⭐⭐ High
- Watch out for: Overextension — best when appearing after a clear downtrend, not after a long rally
7. Piercing Line
A two-candle pattern where a bearish candle is followed by a bullish candle that opens below the prior low but closes more than halfway into the prior candle's body. The piercing line signals buyer strength returning to a downtrend.
- Best timeframe: Daily
- Reliability: ⭐⭐⭐ Moderate
💡 Want these patterns traded automatically? StealthScalp is an automated NinjaTrader 8 bot that identifies high-probability setups and executes trades for you — no screen time required. Learn more →
🔴 Bearish Candlestick Patterns
Bearish patterns signal sellers taking control — typically appearing at the end of an uptrend or at key resistance levels.
8. Shooting Star
The mirror image of the hammer — small body near the bottom with a long upper wick. A shooting star appearing after an uptrend is one of the clearest signs that buyers are exhausted and sellers are stepping in.
The long upper wick shows buyers briefly pushed higher, but sellers smacked price back down. The bulls failed to hold gains.
- Best timeframe: Daily, 4H, 1H
- Reliability: ⭐⭐⭐⭐ High — at resistance zones
- Confirmation: Next candle closes bearish below the body
9. Bearish Engulfing
The bearish counterpart to the bullish engulfing — a large red candle that completely swallows the previous green candle's body. It signals that sellers overwhelmed buyers decisively.
- Best timeframe: Daily, 4H, 1H
- Reliability: ⭐⭐⭐⭐⭐ Very High — especially after extended rallies
- Key signal: Large body + high volume = very strong signal
10. Evening Star
The bearish version of the morning star: large bullish candle → small indecision candle → large bearish candle closing well into the first candle's body. The evening star marks the "sunset" of a bullish move.
- Best timeframe: Daily, Weekly
- Reliability: ⭐⭐⭐⭐⭐ Very High
- Best context: At major resistance levels or overbought conditions
11. Bearish Harami
A large bullish candle followed by a smaller bearish candle contained within the first candle's body. The bearish harami shows that bullish momentum is fading and the market is losing conviction to the upside.
- Best timeframe: Daily, 4H
- Reliability: ⭐⭐⭐ Moderate — stronger at resistance, combined with RSI overbought
12. Three Black Crows
Three consecutive large bearish candles with lower closes — the three black crows signal powerful, sustained selling pressure across multiple sessions. Often marks the beginning of a significant downtrend.
- Best timeframe: Daily, Weekly
- Reliability: ⭐⭐⭐⭐ High
- Watch out for: Gaps between candles weaken the signal
13. Dark Cloud Cover
Two-candle pattern: a bullish candle followed by a bearish candle that opens above the prior high but closes more than halfway into the prior candle's body. Dark cloud cover signals that sellers are taking over from buyers at key highs.
- Best timeframe: Daily
- Reliability: ⭐⭐⭐ Moderate
14. Hanging Man
Identical in shape to the hammer but appears after an uptrend — that's what makes it bearish. The hanging man signals that selling pressure is starting to emerge even though buyers held price up by the close.
- Best timeframe: Daily, 4H
- Reliability: ⭐⭐⭐ Moderate — requires bearish confirmation
⚪ Neutral / Indecision Patterns
These patterns don't predict direction on their own — they signal that the market is at a decision point. Context and what comes next is everything.
15. Doji
A doji forms when the open and close are virtually equal, leaving little to no body. It's the purest signal of market indecision — neither buyers nor sellers won the session.
In isolation, a doji is neutral. But a doji after a strong trend? That's a major warning sign that momentum is stalling.
- Types: Standard Doji, Long-Legged Doji, Gravestone Doji, Dragonfly Doji
- Best timeframe: Daily, 4H — dojis on lower timeframes are too common to be meaningful
- Reliability: ⭐⭐⭐ Moderate — extremely powerful in context
16. Spinning Top
Similar to a doji but with a slightly larger body. A spinning top has long upper and lower wicks with a small real body — it signals uncertainty and balance between buyers and sellers. Neither side is dominant.
- Best timeframe: Daily, 4H
- Reliability: ⭐⭐ Low on its own — use as context for other signals
17. Marubozu
The marubozu is the opposite of a doji — it has a very large body and virtually no wicks. This means price opened at one extreme and closed at the other, with one side in total control the entire session.
- Bullish Marubozu: Opens at low, closes at high — extreme bullish conviction
- Bearish Marubozu: Opens at high, closes at low — extreme bearish conviction
- Reliability: ⭐⭐⭐⭐ High as a momentum/continuation signal
- Best timeframe: Daily, 4H — signals often set the tone for the next session
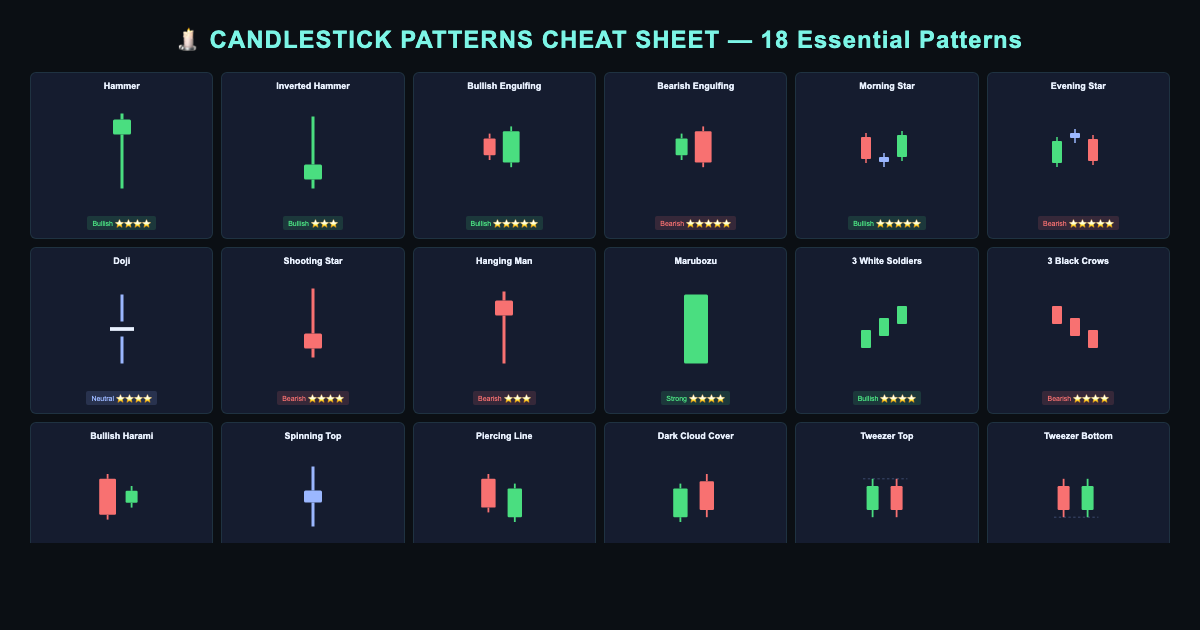
The Candlestick Patterns Cheat Sheet
Here's a quick-reference breakdown of every pattern covered:
| Pattern | Type | Reliability | Best Timeframe |
|---|---|---|---|
| Hammer | 🟢 Bullish Reversal | ⭐⭐⭐⭐ | Daily, 4H, 1H |
| Inverted Hammer | 🟢 Bullish Reversal | ⭐⭐⭐ | Daily, 4H |
| Bullish Engulfing | 🟢 Bullish Reversal | ⭐⭐⭐⭐⭐ | Daily, 4H, 1H |
| Morning Star | 🟢 Bullish Reversal | ⭐⭐⭐⭐⭐ | Daily, Weekly |
| Bullish Harami | 🟢 Bullish Reversal | ⭐⭐⭐ | Daily, 4H |
| Three White Soldiers | 🟢 Bullish | ⭐⭐⭐⭐ | Daily, Weekly |
| Piercing Line | 🟢 Bullish Reversal | ⭐⭐⭐ | Daily |
| Shooting Star | 🔴 Bearish Reversal | ⭐⭐⭐⭐ | Daily, 4H, 1H |
| Bearish Engulfing | 🔴 Bearish Reversal | ⭐⭐⭐⭐⭐ | Daily, 4H, 1H |
| Evening Star | 🔴 Bearish Reversal | ⭐⭐⭐⭐⭐ | Daily, Weekly |
| Bearish Harami | 🔴 Bearish Reversal | ⭐⭐⭐ | Daily, 4H |
| Three Black Crows | 🔴 Bearish | ⭐⭐⭐⭐ | Daily, Weekly |
| Dark Cloud Cover | 🔴 Bearish Reversal | ⭐⭐⭐ | Daily |
| Hanging Man | 🔴 Bearish Reversal | ⭐⭐⭐ | Daily, 4H |
| Doji | ⚪ Neutral | ⭐⭐⭐ | Daily, 4H |
| Spinning Top | ⚪ Neutral | ⭐⭐ | Daily, 4H |
| Marubozu | ⚪ Momentum | ⭐⭐⭐⭐ | Daily, 4H |
How to Use Candlestick Patterns Effectively
Patterns don't exist in a vacuum. The difference between a trader who profits from candlestick signals and one who doesn't comes down to context and confirmation.
Rule 1: Location Matters More Than the Pattern Itself
A hammer at a random point mid-trend means very little. A hammer sitting right on a major support level, after a 10% sell-off, at the 200-day moving average? That's a high-conviction setup. Always ask: where in the trend is this pattern forming?
Rule 2: Always Seek Confirmation
Single-candle patterns especially need confirmation. Wait for the next candle to close in the expected direction before entering. This filters out a large percentage of false signals, especially on lower timeframes.
Rule 3: Higher Timeframes = Higher Reliability
A doji on a 1-minute chart happens dozens of times per session and means almost nothing. A doji on the daily chart after a strong trend is a significant signal. The higher the timeframe, the more "work" went into forming that pattern — and the more meaningful it is.
Rule 4: Combine With Volume and Indicators
Volume confirms conviction. A bullish engulfing candle with 3x average volume is far more powerful than one on thin volume. RSI divergence paired with a hammer at support is a much stronger case than either signal alone.
Rule 5: Define Your Risk Before You Enter
Every pattern has a natural stop-loss level. For hammers and shooting stars, it's below/above the wick. For engulfing patterns, it's below/above the entire two-candle structure. Know your invalidation point before you click buy or sell.
Common Mistakes Traders Make With Candlestick Patterns
Trading Patterns in Isolation
The #1 mistake. Candlestick patterns are one input — not a complete trading system. Traders who act on every hammer they see will blow up their account. Patterns need confluence.
Ignoring the Trend
Bullish reversal patterns have a much lower success rate if you're trying to call a bottom in the middle of a strong downtrend. Always know what the higher-timeframe trend is doing.
Using Too Many Patterns at Once
Master 3-5 high-reliability patterns deeply before adding more to your toolkit. A trader who knows the bullish engulfing, morning star, and hammer inside and out will outperform someone who half-understands 20 patterns.
Take the Guesswork Out With Automation
Even if you know every candlestick pattern in this guide, executing trades consistently is a different skill entirely. Emotions, hesitation, and missed signals are real problems — even for experienced traders.
That's why many serious traders use automation to handle execution. StealthScalp is a fully automated trading bot for NinjaTrader 8 that trades high-probability setups algorithmically — removing emotion and human error from the equation entirely.
Whether you're a futures trader looking to scale or someone who wants to trade while living their life, StealthScalp does the heavy lifting. Check it out here →
Final Thoughts
Candlestick patterns are one of the oldest and most tested forms of price action analysis in the world. They work because they reflect human psychology — fear, greed, uncertainty, and conviction — playing out in real time on your chart.
The patterns in this guide — from the hammer and morning star to the bearish engulfing and three black crows — give you a visual language for reading the market. But remember: the pattern is the signal. The context, confirmation, and risk management are what make it a trade.
Bookmark this page as your candlestick patterns cheat sheet, and start applying these setups in your own analysis. The more you see them in live market conditions, the sharper your pattern recognition becomes.
Happy trading. 📈