Bull Flag vs Bear Flag: A Complete Guide to Flag Patterns in Trading

Flag patterns are among the most reliable continuation setups in technical analysis — but only when you know exactly what you're looking at. Misidentify a bull flag for a bear flag (or vice versa) and you'll enter a trade pointed in the wrong direction.
This guide breaks down bull flags and bear flags side by side: how they form, what volume tells you, how to calculate targets, and the failure rates every serious futures trader needs to know. We'll use real examples from ES and NQ to keep things grounded.
What Is a Flag Pattern?
A flag pattern is a short-term consolidation that forms after a sharp, decisive price move — the flagpole. The consolidation itself is the flag: a tight, often channel-like structure where price drifts against the prior trend before resuming it.
Flag patterns are continuation patterns. They don't signal a reversal. They signal a pause — a brief moment where the market catches its breath — before the dominant trend resumes.
Two key ingredients make a valid flag:
- A strong flagpole — a near-vertical price move on high volume
- Orderly consolidation — a flag that forms in a relatively tight range, ideally drifting against the flagpole direction
Without both, you don't have a flag. You have noise.
Bull Flag vs Bear Flag: The Core Difference
The difference comes down to one thing: direction of the flagpole.
Both patterns share the same DNA — a strong pole, orderly consolidation, and a continuation breakout. The only difference is which way the flagpole points.
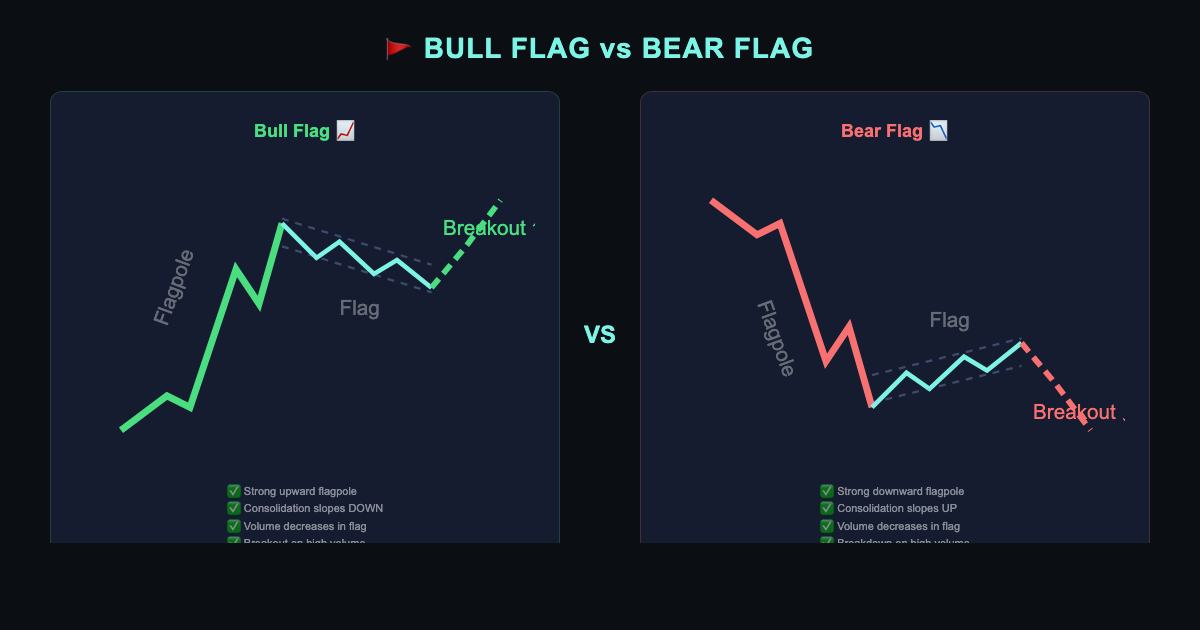
Bull Flag: Flagpole shoots up → flag drifts slightly lower → price breaks upward to continue the uptrend.
Bear Flag: Flagpole drops hard → flag bounces slightly higher → price breaks downward to continue the downtrend.
The Bull Flag Pattern
Formation
A bull flag forms in three phases:
- The flagpole — Price explodes upward, often on a catalyst. This move should be sharp and impulsive, not gradual. Think 1–3 sessions of strong buying.
- The flag — Price consolidates in a slight downward drift or sideways channel. This is controlled selling — institutions holding profits, not dumping positions.
- The breakout — Price breaks above the upper boundary of the flag, resuming the uptrend.
Key structural detail: The flag should not retrace more than 50% of the flagpole. A deeper pullback suggests the trend is weakening, not just pausing.
In NQ futures, a classic bull flag might look like: NQ rips 200 points higher on a strong jobs report → price drifts sideways to slightly lower over the next hour → buyers step back in and push NQ through the prior high.
Volume Characteristics
Volume is what separates a real bull flag from a fake one:
- Flagpole phase: Volume should be significantly above average — 1.5x to 3x normal levels. This confirms institutional participation.
- Flag phase: Volume should contract noticeably. Light volume on the pullback means sellers are not committed. Heavy volume during the flag suggests distribution, not consolidation.
- Breakout: Volume should expand again as price clears the flag's upper boundary. A low-volume breakout has a much higher failure rate.
The mantra: High volume up, low volume consolidation, high volume breakout. That's the ideal bull flag.
Breakout Target
Target = Flag breakout point + Flagpole length
If NQ's flagpole measured 150 points (from pole base to pole top) and price breaks out of the flag at 21,500, your target is 21,650.
Some traders use 50% of the flagpole as a conservative target, especially in choppier market conditions. In ES futures, scaling out at the 50% extension and letting the rest ride is a common approach.
Failure Rates and What They Look Like
Bull flags fail roughly 20–30% of the time — meaning price breaks above the flag, then reverses back inside it (or lower). This is called a failed breakout or a bull trap.
Signs a bull flag is setting up to fail:
- Volume doesn't expand on the breakout
- The flag has multiple deep swings (not orderly)
- Broader market is in a downtrend (trading against the macro)
- The flagpole was on thin volume (momentum wasn't real)
When a bull flag fails, the move lower can be sharp. Respect your stop — typically placed below the flag's low or below the 50% retracement of the flagpole.
The Bear Flag Pattern
Formation
The bear flag is the mirror image of the bull flag:
- The flagpole — Price drops hard, often on heavy selling pressure. Sharp, decisive, impulsive.
- The flag — Price bounces slightly or moves sideways in an upward channel. This is weak buying — short-sellers covering, not real demand entering.
- The breakdown — Price breaks below the lower boundary of the flag, resuming the downtrend.
In ES futures, a bear flag might look like: ES drops 60 points on hotter-than-expected inflation data → price grinds higher in a slow, choppy channel over the next 45 minutes → sellers overwhelm buyers and ES breaks down through the channel's lower trendline.
Critical nuance: The flag's counter-trend bounce should look labored and unconvincing. If buying into the flag is strong and sharp, the pattern's integrity is in question.
Volume Characteristics
The volume signature for bear flags mirrors the bull flag — in reverse:
- Flagpole phase: Heavy selling volume — well above average. Panic selling, institutional liquidation, or a genuine catalyst driving price lower.
- Flag phase: Volume should dry up. Light volume on the bounce tells you the buying isn't backed by conviction. It's relief bouncing, not real demand.
- Breakdown: Volume should pick up as price breaks the lower boundary. If volume doesn't increase on the breakdown, treat the signal with skepticism.
Watch for this trap: Sometimes a bear flag will have a one-bar volume spike during the flag phase — often a short-squeeze bar. What matters is whether the overall volume pattern during the flag is declining. One anomalous bar doesn't invalidate the setup.
Breakout Target
Target = Flag breakdown point − Flagpole length
If ES's flagpole measured 40 points (from pole top to pole bottom) and price breaks down from the flag at 5,800, your target is 5,760.
In trending macro environments — like a prolonged rate-hiking cycle — bear flags in ES and NQ can hit full flagpole extensions consistently. In mean-reverting environments, partial targets are safer.
Failure Rates and What They Look Like
Bear flags fail roughly 25–35% of the time — slightly higher than bull flags, partly because equity futures have an inherent upward bias.
Signs a bear flag is setting up to fail:
- Volume expands significantly on the bounce (real buyers stepping in)
- Price breaks back above the midpoint of the flagpole
- The flag is taking much longer to form than the flagpole did (loss of momentum)
- Major support level sitting just below the breakdown point
A failed bear flag typically sees a sharp reversal higher. Place your stop above the flag's high or above a key resistance level within the flag structure.
Bull Flag vs Bear Flag: Side-by-Side Quick Reference
| Factor | Bull Flag | Bear Flag |
|---|---|---|
| Trend context | Uptrend | Downtrend |
| Flagpole direction | Sharp rally | Sharp drop |
| Flag slope | Slight downward drift | Slight upward drift |
| Flagpole volume | High | High |
| Flag volume | Declining | Declining |
| Breakout direction | Above flag | Below flag |
| Breakout volume | Should expand | Should expand |
| Target formula | Breakout + Flagpole | Breakout − Flagpole |
| Stop placement | Below flag low | Above flag high |
| Failure rate | ~20–30% | ~25–35% |
| Best timeframes | 5m, 15m, 1h, Daily | 5m, 15m, 1h, Daily |
Trading Flag Patterns in ES and NQ Futures
Futures traders have some unique advantages when trading flag patterns:
Extended Hours Context
ES and NQ trade nearly 24 hours. A flag that forms during the overnight globex session often breaks out (or breaks down) at the open — giving you a clean entry with tight spreads and high liquidity.
Economic Catalysts as Flagpoles
NFP, CPI, FOMC decisions — these create perfect flagpole conditions. A 50-point ES drop on a hot inflation print, followed by a 20-minute choppy grind higher with declining volume, is a textbook bear flag. The catalyst does the hard work of creating the pole.
Market Profile Context
Knowing where the prior day's value area sits helps qualify flag breakouts. A bull flag breaking out above the prior day's high, with the Value Area High (VAH) behind it, has a much cleaner path than one fighting into overhead distribution.
Volume Profile Integration
Futures traders can use volume profile to see where real volume was traded. A bear flag forming above a high-volume node (HVN) is more likely to fail than one forming above a low-volume node (LVN) — where price tends to slice through quickly.
Common Mistakes When Trading Flag Patterns
Entering before the breakout. Anticipating the move leads to more losses than wins. Wait for a candle close beyond the flag boundary — not just a wick poke.
Ignoring volume. Volume is the validation layer. A breakout on light volume without subsequent follow-through is a trap more often than not.
Confusing a wedge for a flag. A flag has roughly parallel trendlines. A wedge converges. Wedges often signal exhaustion, not continuation. Know the difference.
Using the wrong timeframe. Flags on a 1-minute chart in low-volatility chop are almost meaningless. Stick to 5-minute, 15-minute, or higher. Daily flags in trending futures markets are some of the most reliable setups available.
Holding through a failed breakout. Failed flags can reverse hard. If price returns inside the flag after breaking out, that's your exit — not a reason to average in.
Automating Flag Pattern Execution with StealthScalp
Spotting a flag is one thing. Executing it — entering at the right price, managing the stop, scaling into targets — is another. Manual execution under pressure leads to hesitation, late entries, and emotional stops.
StealthScalp is an automated trading bot built specifically for NinjaTrader 8 that handles execution so you don't have to. When you identify a flag setup, StealthScalp manages the entry trigger, stop placement, and target scaling automatically — removing emotion from the equation.
🚀 Ready to stop missing flag breakouts? Try StealthScalp free for 7 days — automated NinjaTrader 8 execution built for futures traders.
Flag patterns work best when your execution is as disciplined as your analysis. StealthScalp was built by futures traders who got tired of watching perfect setups turn into losses because of a slow click or an emotional exit.
📊 See how StealthScalp handles flag breakouts in live markets → Learn more
Key Takeaways
- Bull flags form after a sharp rally, consolidate slightly lower, then break upward to continue the trend.
- Bear flags form after a sharp drop, consolidate slightly higher, then break downward to continue the decline.
- Volume is the confirmation layer — declining volume in the flag, expanding volume on the breakout.
- Target = flagpole length added (bull) or subtracted (bear) from the breakout point.
- Failure rates are real — 20–35% depending on conditions. Always use a stop.
- In ES and NQ futures, flag patterns around economic catalysts produce some of the cleanest setups.
- Wait for the close above or below the flag boundary before entering. Wick pokes are traps.
Flag patterns won't make you a profitable trader by themselves. But combined with volume context, market structure awareness, and disciplined execution, they're one of the highest-probability continuation setups in a futures trader's toolkit.