Bearish Reversal Patterns: The Complete Trader's Guide (2025)

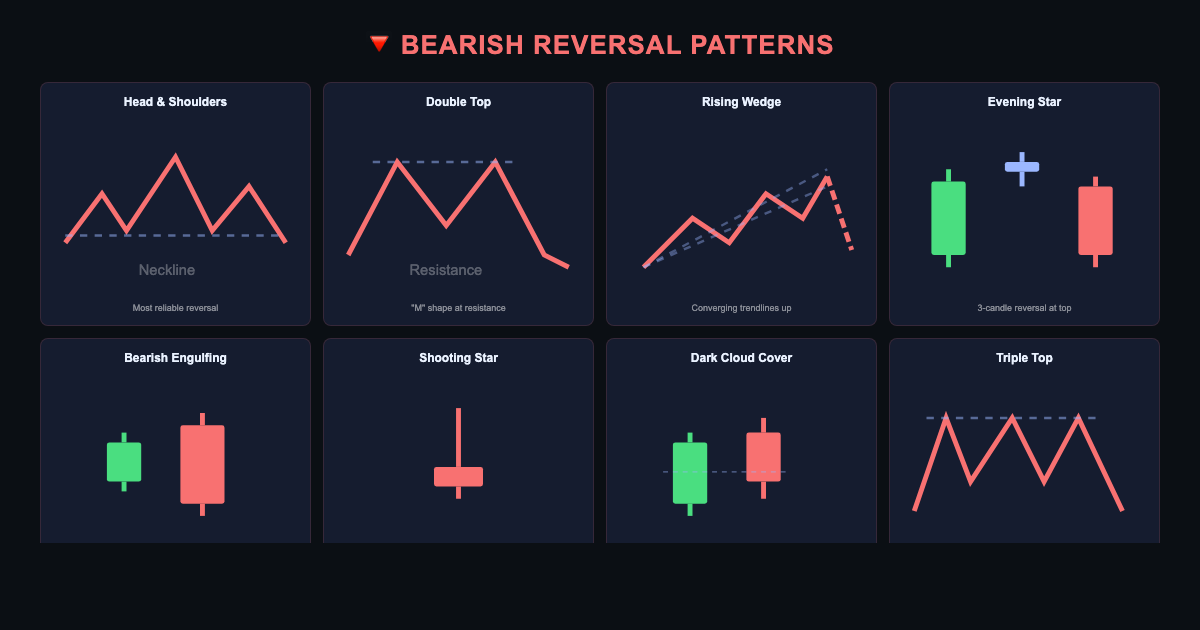

Knowing when a trend is about to flip is one of the most valuable skills in trading. Bearish reversal patterns give you a visual roadmap — price action formations that signal the bulls are losing control and sellers are about to take over.
In this guide, we'll break down the 7 most powerful bearish chart patterns every serious trader needs to know: what they look like, why they work, and exactly how to trade them — entry, stop, and target.
What Are Bearish Reversal Patterns?
A bearish reversal pattern is a price formation that appears at the top of an uptrend and signals a likely shift in momentum to the downside. These patterns form because buying pressure exhausts itself — demand dries up, sellers step in, and the balance of power shifts.
Bearish reversal patterns fall into two categories:
- Chart patterns — multi-candle formations that develop over days or weeks (head & shoulders, double top, rising wedge)
- Candlestick patterns — 1–3 candle signals that form at key resistance levels (evening star, bearish engulfing, shooting star, dark cloud cover)
Used alone, they're useful. Used with volume, trend context, and key levels, they're powerful.
7 Bearish Reversal Patterns You Need to Know
1. Head and Shoulders
The head and shoulders pattern is the gold standard of reversal patterns in trading. It's one of the most reliable and widely-recognized formations in technical analysis.
What it looks like:
- Left shoulder — price rallies and pulls back
- Head — price makes a higher high, then pulls back again
- Right shoulder — price attempts another rally but fails to reach the head
- Neckline — a support line connecting the two pullback lows
The pattern confirms when price breaks below the neckline with conviction.
How to trade it:
- Entry: Short on a close below the neckline, or on a retest of the neckline as resistance
- Stop loss: Above the right shoulder high
- Target: Project the height of the head down from the neckline breakout point
Why it works: Each failed rally shows diminishing buying power. The right shoulder, unable to reach the head's high, tells you sellers are gaining control before the neckline even breaks.
2. Double Top
The double top is a clean, easy-to-spot pattern that forms when price tests a resistance level twice and fails both times — a clear sign that buyers can't break through.
What it looks like:
- Two peaks at approximately the same price level
- A "valley" between the two peaks (the neckline)
- Volume typically decreases on the second peak
How to trade it:
- Entry: Short on a confirmed close below the neckline (the valley low)
- Stop loss: Just above the two peaks
- Target: Measure the height of the pattern from peak to neckline, then subtract from the breakout point
Key tip: The best double tops have the second peak slightly lower than the first — this demonstrates that buyers are running out of steam at that level.
Trade Smarter. Trade Automatically.
StealthScalp is Trinity Trading's automated NinjaTrader 8 bot — built to execute your setups with precision, every time, no emotion involved.
Try StealthScalp → NinjaTrader 83. Rising Wedge
The rising wedge is a deceptive pattern — price is still making higher highs and higher lows, which looks bullish. But the rising support and resistance lines are converging, and that squeeze typically resolves to the downside.
What it looks like:
- Price trending up within two upward-sloping trendlines
- The support line rises faster than the resistance line (they converge)
- Volume often declines throughout the pattern
How to trade it:
- Entry: Short on a break below the rising support trendline
- Stop loss: Above the most recent swing high within the wedge
- Target: The origin of the wedge (where the two trendlines began)
Why traders love this pattern: It often forms after an extended uptrend, catching latecomers off guard when it breaks. The breakdown can be fast and violent.
4. Evening Star
The evening star is a 3-candle bearish candlestick pattern that appears at the top of a trend. It's the bearish counterpart to the morning star and signals a definitive shift in momentum.
What it looks like:
- Candle 1: Large bullish (green) candle — bulls in control
- Candle 2: Small-bodied candle (star) — indecision, gap up preferred
- Candle 3: Large bearish (red) candle that closes deep into Candle 1's body
How to trade it:
- Entry: Short at the open of the next candle after Candle 3 confirms, or on a pullback
- Stop loss: Above the high of the star (Candle 2)
- Target: 1:2 or 1:3 risk/reward based on recent support levels
Confirmation tip: Volume should increase on Candle 3. The deeper Candle 3 closes into Candle 1, the more bearish the signal.
5. Bearish Engulfing
The bearish engulfing is arguably the most straightforward bearish candlestick pattern. Two candles. Crystal clear signal.
What it looks like:
- Candle 1: A bullish candle
- Candle 2: A larger bearish candle that completely engulfs the first candle's body — opens above the previous close and closes below the previous open
How to trade it:
- Entry: Short at the close of the engulfing candle or on the next candle's open
- Stop loss: Above the high of the engulfing candle
- Target: Next significant support level or a 1:2 risk/reward minimum
What makes it powerful: The engulfing candle shows that sellers not only absorbed all the buying pressure from the prior candle — they overwhelmed it. This single shift in candle dynamics often marks the start of a sustained move.
Best contexts: Engulfing patterns carry the most weight at key resistance zones, after extended uptrends, or following a gap up.
6. Shooting Star
The shooting star is a single-candle signal with a long upper wick and a small body near the low of the candle. It tells a story: price rallied hard during the session, but sellers rejected the high and pushed price back down.
What it looks like:
- Small real body (open and close are close together)
- Long upper wick — at least 2x the body length
- Little to no lower wick
- Appears after an uptrend or at resistance
How to trade it:
- Entry: Short on the next candle's open, or on confirmation close below the shooting star's low
- Stop loss: Above the shooting star's high
- Target: Next support level or 1:2 risk/reward
Context is everything: A shooting star at a random point in a trend is weak. A shooting star right at a 52-week high, a key Fibonacci level, or a major resistance zone is a high-probability trade.
7. Dark Cloud Cover
The dark cloud cover is a two-candle bearish candlestick pattern that signals sellers pushing back hard after a bullish candle. Think of it as a partial bearish engulfing — bearish, but not as severe.
What it looks like:
- Candle 1: Strong bullish candle
- Candle 2: Opens above the first candle's close (gap up), then closes below the midpoint of the first candle's body
How to trade it:
- Entry: Short on a break below the low of Candle 2, or on confirmation the next day
- Stop loss: Above the high of Candle 2
- Target: The low of Candle 1, then beyond to the next support zone
Key distinction from bearish engulfing: Dark cloud cover doesn't fully engulf Candle 1's body — but closing below the midpoint is enough to signal bearish intent. Confirmation on the third candle makes this pattern stronger.
How to Confirm Bearish Reversal Patterns
No pattern works 100% of the time. Here's how professional traders stack the odds:
1. Volume confirmation
Bearish patterns with rising volume on the breakdown carry significantly more weight. Volume is the "votes" behind the move.
2. Key resistance confluence
A shooting star at an arbitrary price level is weak. A shooting star at a previous major high, a Fibonacci 61.8% level, or a declining 200-day moving average is a different story entirely.
3. Higher timeframe alignment
If the weekly chart is in a downtrend and your daily chart shows a double top — that's confluence. Trade in the direction of the larger trend.
4. Wait for confirmation
For multi-candle patterns, always wait for the pattern to fully complete before entering. A half-formed head and shoulders that reverses back up will burn you.
5. Risk/reward discipline
Every trade setup, no matter how clean, must have a logical stop and a reward target of at least 1:2. No edge survives poor risk management.
Trading Bearish Patterns in Real Markets
Theory is one thing. Execution is another.
Markets don't print perfect textbook patterns. Real head and shoulders patterns have slightly uneven shoulders. Real double tops might have a few extra candles of chop. Real rising wedges can run longer than expected before breaking down.
This is where pattern recognition meets experience — knowing when a pattern is "close enough" and when it's too messy to trust.
Practical rules for trading bearish reversal patterns:
- Trade the breakout, not the anticipation. Let price confirm before you enter.
- Size your position based on your stop distance. Wider stops = smaller size.
- Have a plan for if the pattern fails. Pre-decide your exit before you enter.
- Keep a trade journal. Tracking which patterns work best for your style is how you develop a genuine edge.
Ready to Execute Without Emotion?
Stop second-guessing your entries. StealthScalp fires the moment your bearish signal confirms — automated, consistent, disciplined.
Get StealthScalp for NinjaTrader 8Frequently Asked Questions
What is the most reliable bearish reversal pattern?
The head and shoulders pattern is widely considered the most reliable, especially when it forms on higher timeframes with volume confirmation on the neckline break.
What's the difference between a bearish reversal and a bearish continuation pattern?
Reversal patterns signal a trend change (from up to down). Continuation patterns signal a pause before the existing trend resumes. Context within the overall trend determines which is which.
Can bearish reversal patterns appear in any market?
Yes — these patterns appear in stocks, futures, forex, crypto, and commodities. The principles of supply and demand that create them are universal.
How do I avoid false signals?
Use confluence: multiple bearish signals at the same level (e.g., a bearish engulfing + resistance zone + declining volume) dramatically reduce false signal risk.
Final Thoughts
Bearish reversal patterns are among the most actionable signals in technical analysis. Whether you're trading the massive structural shift of a head and shoulders, the clean two-touch rejection of a double top, or the sharp intraday signal of a shooting star — each pattern tells you something specific about the battle between buyers and sellers.
Master these seven patterns, apply proper confirmation, and manage your risk — and you'll have a genuine edge in identifying high-probability short setups.
And if you want consistent, disciplined execution every time a setup fires — without the emotion — StealthScalp for NinjaTrader 8 has you covered.
Disclaimer: This content is for educational purposes only and does not constitute financial advice. All trading involves risk.