A 70% Win Rate Strategy That Only Keeps You in the Market 20% of the Time


A 70% Win Rate Strategy That Only Keeps You in the Market 20% of the Time
Why the most capital-efficient strategies let you sit out most of the day — and what that means for your trading.
Most traders believe more time in the market equals more opportunity. More charts. More setups. More trades.
But what if the opposite were true?
A trader recently shared a mean reversion strategy on r/Daytrading that's been blowing up in the community — 1,000+ upvotes and counting. The results? 75% win rate on SPY, profit factor of 2.0, and only 21% time invested over 20 years of backtesting.
Let that sink in: the strategy keeps your capital at work roughly one day per week, yet still outperforms most active traders.
Here's why this matters — and what it reveals about the real edge in trading.
The Strategy: Simple, Mean Reversion, Backtested
The original poster laid out everything transparently. No paid course, no Discord invite — just the raw logic and 20 years of data.
Entry Conditions
The strategy looks for two things:
Price has pulled back significantly from recent highs. Specifically, today's close must be below the 10-day high minus 2.5 times the 25-day average range (high - low).
IBS (Internal Bar Strength) is below 0.3. This means the day closed in the bottom 30% of its range — a sign of weakness that often precedes a bounce.
What's IBS?
Internal Bar Strength is a simple but powerful metric:
IBS = (Close - Low) / (High - Low)
A value of 0 means the day closed at its low (maximum weakness). A value of 1 means it closed at its high (maximum strength).
Values below 0.3 indicate the market closed weak — and in mean-reverting instruments like SPY and QQQ, weakness tends to be followed by recovery.
Exit Condition
Close above yesterday's high.
That's it. No trailing stops, no complex targets. When price confirms strength by closing above the prior day's high, you exit.
The Backtest Results: 20 Years of Data
The trader tested this on multiple instruments. Here's what the numbers showed:
SPY (2006-2026)
| Metric | Value |
|---|---|
| Total Return | 334.84% |
| CAGR | 7.75% |
| Win Rate | 75.00% |
| Profit Factor | 2.02 |
| Max Drawdown | 15.26% |
| Time Invested | 21.02% |
| Avg Hold Time | 5.4 days |
| Total Trades | 240 |
A 75% win rate with a 2.0 profit factor is exceptional. But the real standout is 21% time invested — meaning capital sat in cash nearly 80% of the time.
QQQ (2011-2026)
| Metric | Value |
|---|---|
| Total Return | 265.74% |
| CAGR | 9.18% |
| Win Rate | 70.74% |
| Profit Factor | 2.15 |
| Max Drawdown | 11.92% |
| Time Invested | 16.41% |
Even better drawdown control (11.92%) and only 16% time invested. The tech-heavy QQQ showed similar mean-reverting behavior.
What About Individual Stocks?
The trader also tested AAPL, which showed higher returns (11.77% CAGR) but also higher drawdowns (29.56%). Individual stocks are noisier, so the strategy's edge narrows.
ABNB barely worked at all — 56% win rate, near-zero returns. The lesson: mean reversion works best on diversified, liquid instruments.
Why "Time Invested" Is the Most Underrated Metric
Most traders obsess over win rate, profit factor, and drawdown. But time invested tells you something different: how efficiently are you using your capital?
Consider two strategies:
Strategy A: 8% CAGR, 100% time invested Strategy B: 8% CAGR, 21% time invested
Strategy B is objectively better. Why?
Capital efficiency. Your money is working smarter, not just harder.
Risk exposure. Less time in the market means less exposure to black swans, gap-downs, and overnight risk.
Compounding potential. That 79% of idle time could run a second uncorrelated strategy — or simply stay in cash as dry powder.
Mental bandwidth. You're not watching charts all day. You're not exhausting yourself.
The Reddit thread's top comment captured it perfectly: "The remaining 79% of time could run a different strategy or the same strategy on other instruments."
This is how professional quants think. Not "how much can I trade?" but "how much return per unit of risk and time?"
The Psychology Problem: Why Most Traders Can't Do This
In theory, a 70% win rate strategy that only trades a few times per month sounds ideal.
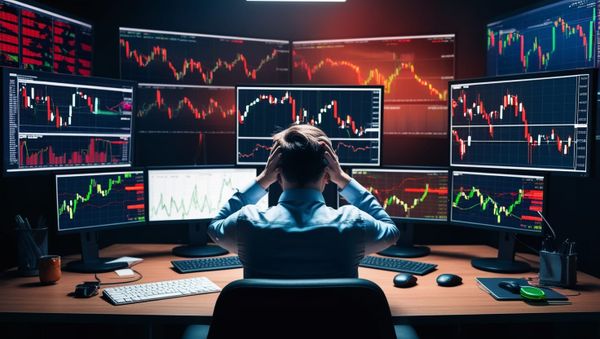
In practice? Most traders would lose their minds.
Here's what happens:
Week 1: No setups. You wait. Week 2: One trade. It wins. Week 3: No setups. You start to wonder if something's wrong. Week 4: You see a "pretty good" setup that doesn't quite meet criteria. You take it anyway. Week 5: That extra trade loses. Now you're frustrated. Week 6: A real setup appears. But you're gun-shy from the loss, so you hesitate.
The strategy itself is simple. The execution is brutal.
As one commenter put it: "The hard part isn't finding the edge. It's sitting on your hands when there's no edge present."
This is why so many traders with perfectly good strategies still blow up. The strategy isn't the problem — the human running it is.
The Case for Waiting
The IBS strategy crystallizes something that experienced traders learn the hard way:
The best trades are the ones you don't take.
Every trade you avoid that doesn't meet your criteria:
- Saves you from potential losses
- Preserves capital for high-quality setups
- Reduces emotional fatigue
- Keeps you from overtrading spirals
The Reddit poster mentioned they only trade when conditions are "optimal — whether in the market or personally." When sick, they simply stopped trading mid-month rather than force subpar performance.
This isn't weakness. It's discipline.
What This Means for Futures Traders
The IBS strategy was tested on SPY and QQQ — ETFs that track indices. But the principle applies directly to futures trading:
Mean reversion works on liquid, diversified instruments. That includes ES (S&P 500 futures) and NQ (Nasdaq futures).
Low time-in-market reduces drawdown risk. For prop firm traders, this is critical. You can't blow through your trailing drawdown if you're in cash most of the time.
Fewer trades = easier position sizing. When you only take 10-15 trades per month, you can size each one appropriately without complex pyramiding schemes.
Time-based filters make sense. The IBS approach doesn't trade every day. Combined with session timing (like only trading the NY session), you're building natural constraints that protect you from overtrading.
The Automation Angle: Why Sitting Out Is Easier When You're Not Watching
Here's the uncomfortable truth: most traders can't execute a "wait for it" strategy because they're glued to their screens.
When you watch charts all day, every small move looks like an opportunity. Your brain starts pattern-matching. You see setups that aren't there. The itch to trade becomes overwhelming.
But when trading is automated — when a system takes the entry and exit without your emotional involvement — the waiting becomes irrelevant.
You set the criteria. The system waits. When conditions are met, it executes. When they're not, it does nothing.
No FOMO. No forcing trades. No giving back morning gains by overtrading in the afternoon.
This is why the "21% time invested" metric matters so much: the best capital efficiency often comes from trading less, not more.
→ StealthScalp is built on this exact principle. One trade per day. Automated execution. No overtrading spiral. The system waits for ICT-based setups to align, then executes with pre-defined risk parameters. Your job is to not interfere.
How to Apply This to Your Own Trading
You don't have to copy the IBS strategy exactly. The deeper lesson is about framework:
1. Define Your Edge Precisely
The IBS strategy has clear, quantifiable entry conditions. There's no "well, it kind of looks like a setup." Either IBS is below 0.3 and price has pulled back sufficiently, or it hasn't.
Ask yourself: Can you describe your entry criteria so specifically that a computer could execute them?
2. Backtest Honestly
The Reddit trader tested across 20 years, multiple instruments, and included slippage and commissions. They also showed where it didn't work (ABNB).
Ask yourself: Do you know your strategy's historical performance across different market conditions? Or are you just remembering your best trades?
3. Track Time Invested
Most traders have no idea how much of the time they're actually in positions versus watching and waiting.
Ask yourself: If you calculated your "time invested" like the IBS backtest, would you be at 20%... or 80%?
4. Build Systems That Enforce Patience
Whether that's automation, rules-based checklists, or simply closing your trading platform outside specific hours — find a way to protect yourself from yourself.
Ask yourself: What would change if you physically couldn't take trades that don't meet your criteria?
The Bottom Line
A 70% win rate, 2.0 profit factor strategy that only trades 20% of the time sounds too good to be true.
But the math checks out. The backtest is transparent. And the principle is sound: mean reversion works on liquid indices, and less time in the market means better capital efficiency.
The catch? You have to actually sit out the other 80% of the time. No "just this once" trades. No forcing setups that aren't there. No overtrading because you're bored.
For most humans, that's nearly impossible.
For automated systems? That's the default behavior.
Maybe the real edge isn't the strategy at all — it's the ability to execute it without interference.
→ Ready to remove yourself from the equation? StealthScalp runs one trade per day, automated, without the psychological noise. Let the system wait while you live your life.
Inspired by a viral r/Daytrading post: "70% Win Rate Setup that I Found Hiding in Plain Sight" (1,000+ upvotes, March 2026). The author shared a complete mean reversion system with 20 years of backtest data.