Best NinjaTrader Indicators for Day Trading in 2025
Discover the most powerful NinjaTrader indicators for futures day trading. From order flow to volume profile, here are the tools professional traders actually use.


NinjaTrader remains the platform of choice for serious futures traders—and for good reason. Its advanced charting, customization options, and indicator ecosystem are unmatched. But with thousands of indicators available, how do you know which ones actually work?
In this guide, we'll break down the best NinjaTrader indicators for day trading futures, categorized by function and use case.
Why Indicators Matter (And Why Most Don't Work)
Here's the truth about trading indicators: 90% of them are useless.
Moving average crossovers, RSI, MACD, Stochastics—these lagging indicators tell you what already happened, not what's about to happen.
Professional traders use indicators differently. They look for:
- Real-time market structure (not delayed signals)
- Order flow and volume (where the money is)
- Clear, actionable setups (not cluttered charts)
The indicators below are what actually move the needle.
Category 1: Order Flow Indicators
Order flow analysis shows you what the market is doing in real-time—not what it did 10 bars ago.
What Order Flow Shows You
- Aggressive buyers vs sellers — Who's in control right now?
- Absorption — Big players absorbing selling pressure
- Exhaustion — When a move is running out of steam
- Imbalances — Where price is likely to go next
Best Order Flow Tools for NinjaTrader
Footprint Charts
Shows bid/ask volume at each price level within a candle. You can see:
- Where buyers stepped in
- Where sellers dominated
- Exact price levels of absorption
Delta Indicators
Tracks the difference between buying and selling volume. Positive delta = more buying, negative delta = more selling.
Cumulative Delta
Running total of delta—shows if buyers or sellers are winning overall.
→ Trinity Trading offers professional order flow tools designed specifically for futures day traders.
Category 2: Volume Profile Indicators
Volume Profile shows where trading activity occurred at each price level—not just over time, but by price.
Key Volume Profile Concepts
Point of Control (POC)
The price with the most trading activity. Acts as a magnet for price.
Value Area (VA)
The range where 70% of trading occurred. Price tends to stay within or return to the value area.
High Volume Nodes (HVN)
Areas of heavy trading. Price often consolidates or reverses at HVNs.
Low Volume Nodes (LVN)
Areas of light trading. Price moves quickly through LVNs.
How Traders Use Volume Profile
- Identify support/resistance — HVNs are natural S/R levels
- Plan entries — Buy at VAL (Value Area Low), sell at VAH (Value Area High)
- Set targets — Price often moves from one HVN to another
Best Volume Profile Indicators
Look for indicators that show:
- Session Volume Profile (today's activity)
- Composite Volume Profile (multiple days)
- Developing POC (updates in real-time)
Category 3: Support & Resistance Indicators
Manual support and resistance works, but it's time-consuming and subjective. Good indicators automate this process.
What to Look For
- Automatic level detection — Finds key levels without manual drawing
- Multiple timeframe analysis — Shows which levels matter most
- Dynamic updates — Adjusts as new levels form
- Clean visualization — Shows levels without chart clutter
Types of S/R Indicators
Pivot Points
Classic mathematical levels based on previous session's high, low, close. Still used by institutional traders.
Supply/Demand Zones
Areas where price made sharp moves—indicating strong buying or selling interest.
Swing High/Low Detection
Automatically marks significant peaks and valleys.
Category 4: Trend and Momentum Indicators
While lagging indicators get a bad rap, some trend tools are actually useful when applied correctly.
SuperTrend
A volatility-based trend indicator that works well for:
- Identifying the dominant trend direction
- Setting trailing stops
- Filtering trades (only long in uptrend, only short in downtrend)
VWAP (Volume Weighted Average Price)
The institutional benchmark. Professional traders know:
- Above VWAP = bullish bias
- Below VWAP = bearish bias
- VWAP retest = often a good entry point
ATR (Average True Range)
Not a signal indicator—but essential for:
- Setting stop losses (e.g., 2x ATR)
- Position sizing
- Measuring volatility
Category 5: Trade Management Indicators
These don't generate signals—they help you manage trades once you're in.
What Good Trade Management Tools Do
- Automatic stop adjustment — Trail stops as price moves
- Partial profit targets — Scale out at predetermined levels
- Break-even automation — Move stop to entry after X profit
- Risk/reward visualization — See R:R before entering
Why This Matters
Most traders enter at decent levels but manage trades poorly. Good trade management:
- Protects profits
- Limits losses
- Removes emotional decision-making
→ Trinity Trading includes trade management tools that help you protect profits and limit losses automatically.
The "Less is More" Approach
Here's what a professional day trader's chart actually looks like:
Clean Chart Setup
- Price action (candles or footprint)
- Volume Profile
- VWAP
- 1-2 custom indicators
That's it. No rainbow of overlapping indicators. No indicator panels covering half the screen.
Why Simplicity Works
- Faster decision-making
- Clearer signals
- Less confusion
- Better execution
Setting Up NinjaTrader for Day Trading
Recommended Chart Settings
Timeframes
- Primary: 5-minute for entries
- Secondary: 15-minute for context
- Tertiary: 1-hour for trend
Chart Type
- Candles for price action
- Footprint for order flow entries
- Volume bars for scalping
Color Scheme
- Dark background (easier on eyes)
- High contrast candles
- Subtle indicator colors (don't distract from price)
Free vs Paid Indicators: What's the Difference?
Free Indicators
Pros:
- No cost
- Good for learning
- Basic functionality
Cons:
- Limited features
- No support
- Often outdated
- May have bugs
Professional Paid Indicators
Pros:
- Advanced features
- Regular updates
- Customer support
- Optimized performance
- Unique functionality not available elsewhere
Cons:
- Cost money
- Learning curve
The Real Question
How much is a quality indicator worth if it helps you:
- Pass a prop firm evaluation
- Make better entries
- Manage risk more effectively
- Trade with more confidence
For most serious traders, the ROI on quality tools is massive.
Common Indicator Mistakes to Avoid
Mistake 1: Indicator Overload
More indicators ≠ better trading. They often contradict each other, causing analysis paralysis.
Mistake 2: Not Understanding How It Works
If you can't explain what an indicator measures and why, don't use it.
Mistake 3: Using Indicators as "Holy Grails"
No indicator is right 100% of the time. They're tools to support decision-making, not replace it.
Mistake 4: Ignoring Context
Indicators work differently in trending vs ranging markets. Know when to use what.
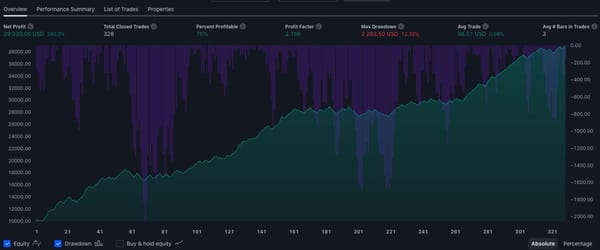
Mistake 5: Not Backtesting
Before trading live, test your indicator setup on historical data. Does it actually work?
Recommended Indicator Stack for Futures Day Trading
Here's a proven setup for ES/NQ day trading:
For Analysis:
- Volume Profile (session + developing)
- Order Flow/Footprint
- VWAP with standard deviations
- For Entries:
- Custom signal indicator (like Trinity Trading tools)
- S/R levels (auto-detected)
- For Management:
- ATR for stops
- Trade management tool for automation
- Ready to upgrade your NinjaTrader setup? Trinity Trading offers a suite of professional indicators designed specifically for futures day traders:
- Order Flow Tools — See what the market is actually doing
- Volume Profile — Know where the action is
- Signal Indicators — Clear, actionable entries
- Trade Management — Protect profits automatically
- Whether you're trading a personal account or working on a prop firm evaluation, having the right tools makes all the difference.
- → Explore Trinity Trading Indicators
- Trading involves significant risk. Indicators don't guarantee profits. Always practice proper risk management.